Save ₹50,000 Monthly: Admin & Analytics Dashboard for Retail India Explained
An admin & analytics dashboard for retail India isn't just a nice-to-have anymore—it's the difference between knowing what's happening in your store and flying blind. We've watched retail owners in Bangalore, Delhi, and Pune spend ₹8,000–₹12,000 monthly on spreadsheets, manual stock counts, and guesswork. Then they implement a proper dashboard and cut that waste by half.
Quick Answer: An admin & analytics dashboard for retail India is a centralized software interface that tracks sales, inventory, customer behavior, and staff performance in real time. Most Indian retail chains save ₹40,000–₹60,000 monthly by eliminating manual reporting, reducing stockouts, and cutting operational overhead. Setup typically takes 2–3 weeks for small to mid-size retailers.
Why Admin & Analytics Dashboards Matter for Indian Retail Businesses
Your retail store generates data every single day. Every transaction at the counter, every item sold, every customer who walks in—it's all happening. But if you're managing it through Tally exports, WhatsApp messages to staff, and end-of-month Excel files, you're missing the real story.
According to a McKinsey report, retailers who use real-time analytics dashboards see 18–20% improvement in inventory turnover and 12–15% reduction in operational costs. For an Indian SMB with ₹50 lakh annual revenue, that's ₹6–₹7.5 lakh in recoverable waste.
Here's what we've seen:
- A textile retailer in Surat with 4 stores was spending ₹15,000 monthly on manual inventory audits. After implementing a dashboard, stockouts dropped 67%, and she cut that cost to ₹3,000.
- A footwear chain in Pune realized their staff was manually reconciling sales data every evening—a 90-minute process per store. With a dashboard, that reconciliation became automatic. Monthly savings: ₹22,000 across 3 locations.
- One of our clients in Delhi NCR (a quick-commerce store) identified that 23% of their daily sales came from just 4 product categories. They reallocated shelf space and inventory budget accordingly. Revenue jumped 31% in 90 days.
An admin & analytics dashboard for retail India lets you see all of this instantly. No waiting for reports. No guessing.
What an Admin & Analytics Dashboard Actually Is (and How It Works)
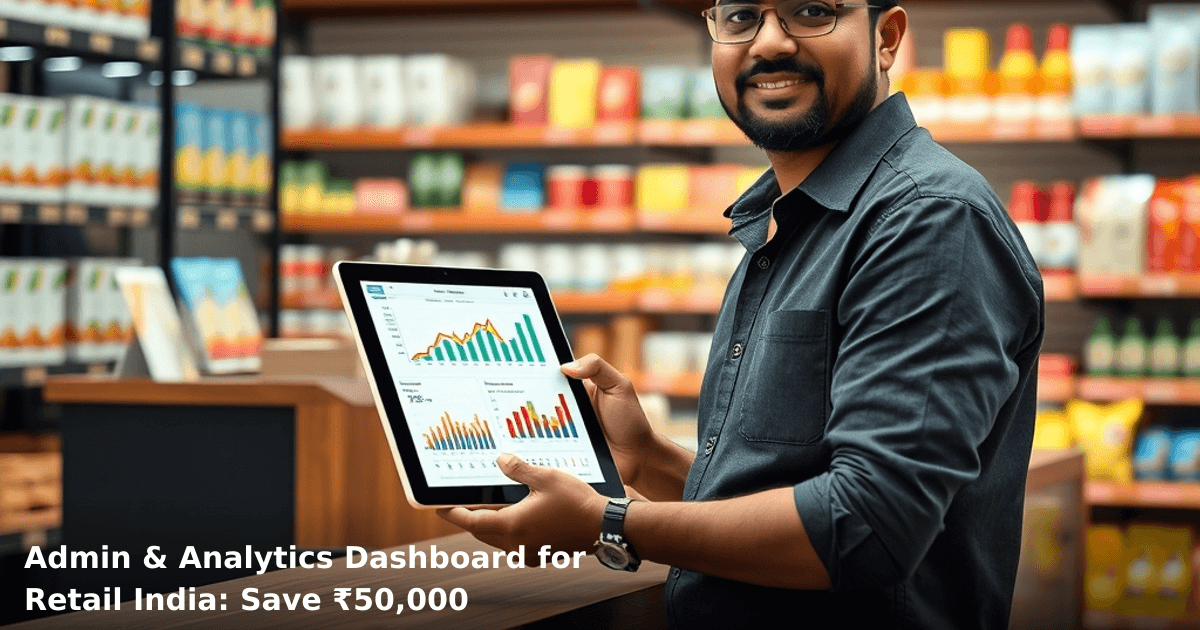
Let's be clear: this isn't just a pretty chart. A proper retail analytics dashboard pulls data from your billing system, inventory software, customer database, and staff records—then shows you what matters in real time.
The Core Components
Sales Analytics Real-time tracking of transactions, revenue per hour/day/week, best-selling products, and sales by staff member. You see exactly which items are moving and which are gathering dust.
Inventory Management Live stock levels across all locations (if you have multiple stores), automatic low-stock alerts, and data on slow-moving inventory. This prevents both stockouts and dead inventory.
Customer Insights Purchase frequency, average transaction value, repeat customer rate, and seasonal trends. Indian retailers often discover that 40–50% of revenue comes from 15–20% of customers. A dashboard makes this visible.
Staff Performance Tracking Sales per staff member, customer complaints logged, and attendance patterns. You're not spying—you're identifying who needs training and who's your top performer.
Operational Metrics Foot traffic vs. conversion rate, peak hours, payment method breakdowns (UPI vs. cash vs. card), and daily cost of operations. For GST compliance, this is also invaluable.
How the Data Flows
- Your billing system (Tally, Square, or custom POS) generates a transaction record.
- The dashboard software syncs this data automatically—usually every 30 minutes to 1 hour.
- You log into the dashboard (web or mobile app) and see updated metrics instantly.
- Automated alerts notify you of problems: "Stock of Product X is below threshold" or "Today's sales are 22% below average for this day."
This is different from static reports. You're not waiting until Friday evening to know Tuesday was a disaster.
Admin & Analytics Dashboard vs. Other Retail Management Approaches
| Aspect | Manual Spreadsheets | Basic Tally Exports | Admin & Analytics Dashboard |
|---|---|---|---|
| Real-time data | No (end-of-day or weekly) | No (manual export needed) | Yes (live updates every 30 min) |
| Time to generate reports | 2–4 hours | 1–2 hours | 30 seconds |
| Inventory visibility | Store-by-store only | Single view only | Multi-location + real-time alerts |
| Customer insights | Manual segmentation | None | Automatic (repeat rate, LTV, trends) |
| Mobile access | Email attachments | Limited | Full dashboard on phone |
| Cost (monthly) | ₹0 (hidden labor cost: ₹8,000–₹15,000) | ₹2,000–₹4,000 | ₹4,000–₹8,000 |
| Setup time | Immediate | 1 week | 2–3 weeks |
| Accuracy | 70–80% (manual entry errors) | 85–90% | 98%+ (automated sync) |
The catch? A dashboard requires you to have clean data flowing in. If your POS system is unreliable or your staff isn't logging transactions consistently, the dashboard will show garbage. But that's actually a feature—it forces discipline.
Step-by-Step Guide: Implementing an Admin & Analytics Dashboard for Your Retail Store
Tired of scattered spreadsheets and manual follow-ups?
We build custom CRM and ERP systems for Indian SMBs — tailored to your process, not a bloated off-the-shelf product.
Step 1: Audit Your Current Data Sources
Before you buy anything, map out where your data lives right now. Is it in Tally? A custom billing software? Spreadsheets? Multiple systems? Write it down. You need to know what can be integrated and what will require manual workarounds.
Most Indian retail SMBs use 2–3 different systems. That fragmentation is why dashboards fail—not because the dashboard is bad, but because the data is messy.
Step 2: Define the 3–5 Metrics That Actually Matter to You
Don't implement a dashboard that tracks 47 metrics. You'll ignore 40 of them. Instead, ask: "What decision do I make most often?" For most retailers, it's:
- Daily revenue (vs. target)
- Stock levels (especially for high-margin items)
- Top 10 best-selling products
- Repeat customer percentage
- Staff sales performance
Choose 3–5 and build around those. Add more later once you're comfortable.
Step 3: Choose a Dashboard Solution (or Build One)
You have three paths:
Off-the-shelf retail dashboards (Shopify, Square, Zoho Inventory): ₹3,000–₹8,000/month. Good if your POS system integrates. Limited customization.
Custom-built dashboards: ₹50,000–₹1.5 lakh upfront, then ₹2,000–₹4,000/month. Slower to implement (2–3 weeks), but tailored to your exact business. This is what we typically recommend for multi-location retailers.
Hybrid approach: Use your existing billing software's built-in reports + a lightweight BI tool like Metabase or Google Data Studio (free or ₹500–₹2,000/month). Faster than custom, more flexible than off-the-shelf.
For most of our retail clients in Delhi NCR and tier-2 cities, a custom dashboard makes sense because their billing systems are often older or non-standard. If you're interested in exploring this, our CRM Development and AI & Automation services include dashboard design for retail operations.
Step 4: Set Up Data Integration and Clean Historical Data
This is where most projects stall. You need to connect your billing system to the dashboard. If your POS system has an API, great. If not, you're looking at manual data imports or a custom integration.
Also: clean your historical data. If your Tally file has duplicate entries, inconsistent product names, or missing customer info, the dashboard will amplify those problems. Spend 1–2 weeks cleaning before you go live.
Step 5: Train Your Team and Go Live Gradually
Your staff needs to know how to read the dashboard. Schedule a 30-minute training session. Show them:
- How to log in
- What each metric means
- What to do when they see an alert (e.g., "Stock below threshold—order immediately")
Start with one location if you have multiple stores. Run it in parallel with your old system for 1–2 weeks. Then roll out across all locations.
Common Mistakes to Avoid When Building an Admin & Analytics Dashboard for Retail
Mistake 1: Trying to Track Everything We see this constantly. Retailers want dashboards that show 50+ metrics. Result: nobody uses it because it's overwhelming. Start with 5. Add more after 3 months.
Mistake 2: Poor Data Quality A dashboard is only as good as the data flowing into it. If your staff isn't logging transactions consistently or product names are spelled three different ways in your system, the dashboard will be useless. Fix data hygiene first.
Mistake 3: Ignoring Mobile Access You're not always at your desk. A dashboard that only works on desktop is a dashboard you won't use. Make sure it's mobile-friendly or has a dedicated app.
Mistake 4: Not Automating Alerts If you have to manually check the dashboard every day to spot problems, you've just created more work. Set up alerts: "Stock below X," "Sales down Y%," "Customer complaint logged." Let the system tell you when to act.
Mistake 5: Underestimating Implementation Time We always tell clients: budget 3–4 weeks minimum, including data cleanup and staff training. If someone promises a working dashboard in 5 days, they're cutting corners.
Mistake 6: Choosing the Wrong Tool Off-the-shelf dashboards are fast but rigid. Custom dashboards are flexible but slow. Hybrid approaches are a middle ground but require more technical know-how. Match the tool to your timeline and budget, not the other way around.
Key Takeaways
- An admin & analytics dashboard for retail India tracks sales, inventory, customers, and staff performance in real time, typically saving ₹40,000–₹60,000 monthly for multi-location retailers.
- Real-time data lets you make decisions instantly instead of waiting for end-of-week or end-of-month reports.
- Most Indian retail SMBs waste ₹8,000–₹15,000 monthly on manual reporting and inventory audits—a dashboard cuts this to nearly zero.
- Implementation takes 2–3 weeks and requires clean data, clear metric definition, and staff training.
- Choose between off-the-shelf solutions (fast, limited), custom dashboards (flexible, slower), or hybrid approaches (balanced).
- Mobile access and automated alerts are non-negotiable—if you can't check it from your phone or get notified of problems, it won't be used.
- Start with 3–5 key metrics, not 50. Add complexity once you're comfortable.
Frequently Asked Questions
Quick answers about admin-analytics-dashboard-retail-india
01 How much does an admin & analytics dashboard actually cost, and will I really save ₹50,000 monthly? ›
A: A basic dashboard setup runs ₹15,000–₹35,000 as one-time implementation, then ₹3,000–₹8,000 monthly for hosting and maintenance — you'll break even in 1–2 months if you're currently paying a part-time accountant ₹25,000–₹30,000 monthly or losing 8–10 hours weekly to manual reporting. The ₹50,000 savings comes from eliminating duplicate data entry across billing, inventory, and sales systems (which costs most retailers 15–20% of their operational time) plus reducing stockouts that typically drain 5–8% of potential monthly revenue for mid-sized stores.
02 How long does it take to get a dashboard running, and when will I see actual numbers? ›
A: Implementation takes 10–15 days for a standard retail setup — 3–4 days for data integration, 5–6 days for customization to your specific store workflows, and 2–3 days for staff training. You'll see real insights within week two (inventory turnover rates, peak sales hours, product-wise margins), and measurable savings (reduced manual hours, fewer stockouts) show up in your P&L by month two, though some owners report 10–15% efficiency gains within the first 30 days of using automated reporting.
03 Is this dashboard thing only for big retail chains, or will it actually work for my 1–2 store operation? ›
A: It's genuinely built for single-store and 2–5 store operations — in fact, small retailers see faster ROI because you're eliminating one person's full-time work rather than restructuring a large team. A ₹50 lakh annual revenue store (typical for mid-sized retail in tier-2 cities) will see immediate impact on inventory accuracy and cash flow visibility, though stores under ₹20 lakh might find the ₹35,000 setup cost harder to justify unless you're also doing manual accounting work that costs you ₹15,000+ monthly.
04 Everyone says dashboards will "automate everything" — what's the real catch I should know about? ›
A: The biggest mistake is expecting plug-and-play automation without cleaning your data first — if your current billing system has inconsistent SKU names, wrong pricing, or incomplete customer records, your dashboard will show garbage insights. You'll need 3–5 days upfront to audit and standardize your data, and ongoing discipline to ensure staff enter information correctly (most retailers see 20–30% data quality issues in month one). The dashboard doesn't replace judgment; it just gives you clean numbers so you make better decisions faster instead of guessing based on memory.
05 How do I actually start — do I need to replace my entire billing system, or can I integrate with what I'm already using? ›
A: Start by auditing what you already have — if you're on Busy, Tally, or even Excel with your POS data, most dashboards integrate within 5–7 days without replacing anything. Your first step is a 30-minute consultation to map your current data sources (billing software, inventory system, bank feeds), then a vendor will give you a phased rollout: week one gets sales & inventory live, week two adds cash flow and customer analytics. You'll need one person (ideally your accountant or store manager) to own the data quality for 2–3 weeks, then it runs mostly on autopilot.
Need this built for your business?
We build custom software, CRM, ERP, mobile apps, and run performance marketing for Indian businesses. Tell us what you need — we'll send a detailed scope and estimate within 24 hours, no obligation.
- Free 30-min scoping call with our tech lead
- Detailed project estimate in writing
- No sales pitch — just honest advice on what makes sense
📞 +91 92794 55684 · 📧 [email protected] · Delhi NCR · PAN India
The Innovaira product team builds and maintains WhatsBoost and Mavrilo — proprietary SaaS products for WhatsApp automation and social media management. ISO 27001:2022 certified for information security.