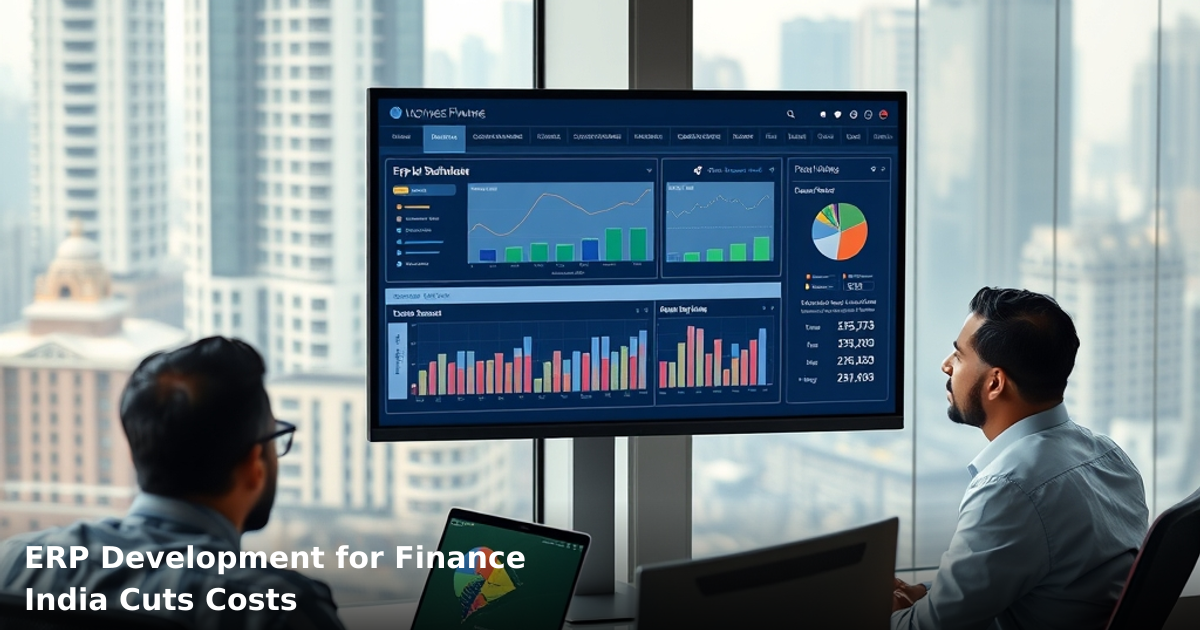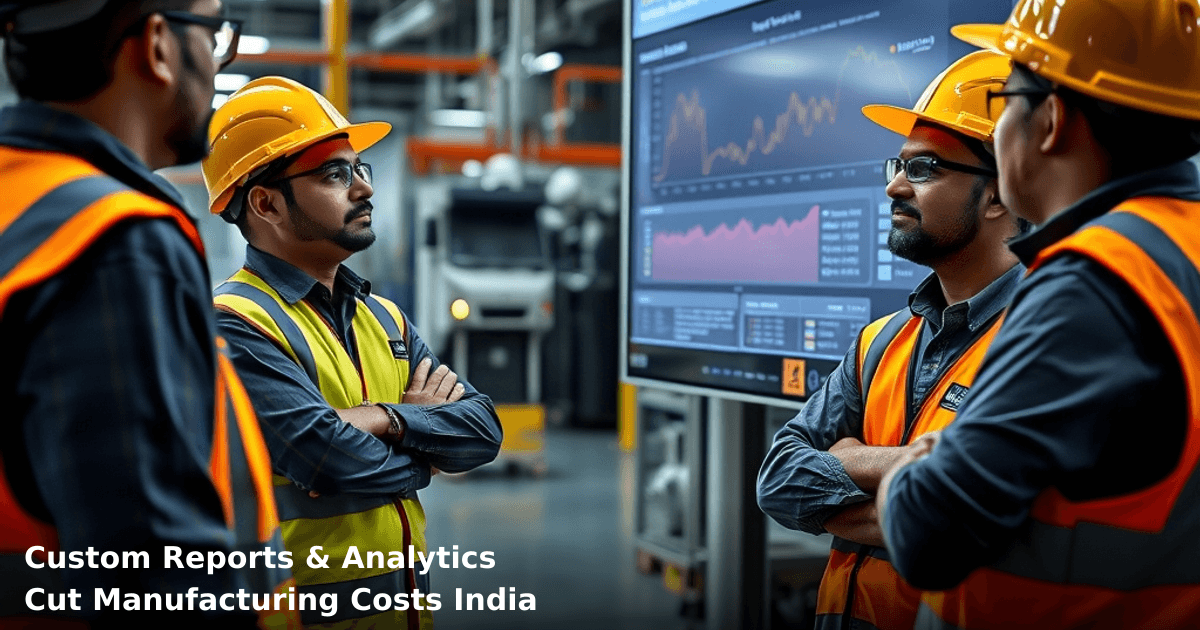
7 Ways Custom Reports & Analytics Cut Manufacturing Costs in India
Your production line just lost 4 hours to a machine failure. Your inventory team can't find the SKU data they need. Your finance department is still waiting for last month's profit margin report—it's mid-month. This is the reality for most Indian manufacturers: data exists, but it's scattered, slow, and buried in spreadsheets.
Custom reports & analytics for manufacturing India solve this. They turn raw factory data into actionable insights that shrink waste, speed up decisions, and cut costs by 15–40% within the first year.
Quick Answer: Custom reports & analytics for manufacturing India consolidate production, inventory, and financial data into real-time dashboards that reduce downtime by 20–30%, cut inventory holding costs by ₹2–5 lakh annually, and accelerate decision-making from days to hours. Most Indian SMBs see ROI within 6–9 months.
Why Custom Reports & Analytics Matters for Indian Manufacturers
You're competing against larger players with bigger tech budgets. But you have something they don't: agility. The problem is, you can't be agile without visibility.
According to a McKinsey report, manufacturers who use real-time analytics reduce operational costs by 12–15% and improve asset utilization by 10–20%. In India, where margin pressures are tighter and raw material costs fluctuate monthly, this matters even more.
A textile exporter in Surat we worked with was losing ₹80,000 per month to untracked machine downtime. They had the data—maintenance logs, production schedules, sensor readings—but it lived in three different systems. Once we built custom dashboards pulling all that data together, they spotted the pattern in 48 hours: a specific spindle was failing every 6 days. Replacing it cost ₹15,000 once. The savings: ₹80,000/month, or ₹9.6 lakh annually.
That's what custom reports & analytics for manufacturing does. It makes the invisible visible.
What Custom Reports & Analytics Actually Are (And Why Generic Dashboards Fail)
Your ERP has reports. Your accounting software has reports. But none of them talk to each other. A "generic" dashboard shows you production hours or inventory levels in isolation. A custom report shows you why your production hours are up but your output is flat, or why your inventory turnover has slowed.
Custom analytics means:
- Real-time data pulls from your machines, ERP, inventory system, and accounting software—all in one place
- Industry-specific KPIs that matter to manufacturing: OEE (Overall Equipment Effectiveness), changeover time, scrap rate, inventory days on hand, cost per unit
- Automated alerts when something breaks the pattern (machine downtime exceeds 2 hours, waste exceeds 5%, inventory falls below reorder point)
- Drill-down capability so you can see the headline "Production is down 12%" and then click through to see it's because of a specific shift, line, or machine
Generic dashboards fail because they show what. Custom reports show why and what to do about it.
7 Ways Custom Reports & Analytics Cut Manufacturing Costs in India
1. Reduce Unplanned Downtime by 20–30%
Machine downtime in Indian manufacturing averages ₹15,000–₹50,000 per hour depending on the industry. A custom analytics setup flags when a machine is running slower than normal, when maintenance is overdue, or when a part is likely to fail.
One of our clients—a precision components manufacturer in Pune—was averaging 6–8 hours of unplanned downtime per month. Their maintenance team was reactive: they fixed things after they broke. We built a custom report pulling data from their IoT sensors, production logs, and maintenance history. The report showed patterns: specific machines needed oil changes every 45 days, not the standard 60. Another machine's vibration levels were rising 3 days before failure.
Result: They cut unplanned downtime to 1–2 hours per month. That's ₹1.8–₹7.2 lakh saved annually, depending on how you calculate it.
2. Optimize Inventory Holding Costs (Save ₹2–5 Lakh/Year)
Indian manufacturers typically hold 30–60 days of inventory. That ties up working capital. Custom analytics shows you exactly which SKUs are moving, which are sitting, and which are about to expire or become obsolete.
A plastics manufacturer in Ahmedabad had ₹18 lakh locked in slow-moving inventory. Their finance team couldn't see it clearly because the data was split between their Tally accounting software and a manual Excel sheet. We built a custom report that pulled inventory age, turnover rate, and cost per SKU. Within 2 weeks, they identified ₹4.2 lakh in inventory that could be liquidated or returned to suppliers.
Custom reports & analytics for manufacturing India also help you forecast demand more accurately. If you know that your orders spike in October–November (Diwali season, festival inventory), you can build inventory strategically instead of guessing.
Typical savings: ₹2–5 lakh annually in freed-up working capital, plus 5–10% reduction in storage and handling costs.
3. Cut Scrap and Rework by 10–25%
Scrap costs most manufacturers 3–8% of revenue. A 5-tonne steel fabrication shop might lose ₹2–3 lakh monthly to scrap, rework, and quality issues.
Custom analytics tracks scrap by machine, operator, shift, material lot, and product. You'll see patterns: maybe your scrap rate spikes on night shift, or with a specific supplier's material, or on Mondays. Once you see the pattern, you can fix it.
We worked with a metal components factory in Jamnagar that had a 6% scrap rate. Their quality team had no visibility into why. We built a custom report that showed scrap by machine, material batch, and shift. They discovered that one machine was out of calibration (costing ₹18,000/month in scrap), and a specific supplier's material had defects (costing ₹12,000/month). Fixing both issues cut their scrap rate to 2.5% within 60 days.
That's ₹30,000/month saved, or ₹3.6 lakh annually.
4. Speed Up Decision-Making (From Days to Hours)
Right now, your production manager emails your finance team asking for last month's margin by product line. Finance pulls it from Tally, builds an Excel sheet, emails it back. By the time you have the data, the production run is over.
Custom analytics puts that data in front of you in real-time. Your production manager can see margin by product line today, not next week. Your procurement team can see which suppliers are costing more than budget today, not after GST reconciliation.
This speed matters. In manufacturing, decisions that are 3 days late cost money. A custom dashboard lets your team make decisions 3 days earlier.
Speed also reduces errors. No more manual data entry. No more "the Excel file has a formula error somewhere and nobody knows where."
5. Improve Capacity Utilization by 12–18%
Most Indian SMB manufacturers don't know their true capacity utilization. You have a 200-tonne press. It's "busy most days." But are you actually running it 16 hours a day or 8 hours?
Custom reports & analytics for manufacturing India show you utilization by machine, shift, and product line. You'll see dead time, changeover time, and idle time. Once you see it, you can plan better: maybe you can batch similar products to reduce changeover, or shift low-priority jobs to night shift to free up prime time.
A pharmaceutical packaging company in Baddi increased their utilization from 62% to 74% (12% improvement) by batching production based on insights from custom dashboards. That let them take on ₹25 lakh in additional annual revenue without buying new equipment.
6. Reduce Material Waste and Shrinkage by 8–15%
Material waste happens in production (offcuts, spillage, defects), but also in storage and handling (evaporation, spillage, theft, damage). Custom analytics tracks material flow: what came in, what was used, what was scrapped, what's in inventory, what went out.
The gap between "what should be there" and "what is there" is waste and shrinkage. In Indian manufacturing, this often runs 5–12% depending on the industry (textiles are higher, precision components lower).
A chemical manufacturer in Gujarat had 8% shrinkage. They thought it was just normal. A custom report showed them that 60% of the shrinkage happened during transfer between the production floor and warehouse. They improved their handling procedures and reduced shrinkage to 2.5%.
That's 5.5% of material cost saved. For a ₹2 crore revenue business, that's ₹11 lakh annually.
7. Improve Supplier Performance and Negotiate Better Terms
You work with 15–20 suppliers. Some deliver on time, some don't. Some have defect rates of 2%, others 8%. But you probably don't have this data in one place.
Custom analytics consolidates supplier metrics: on-time delivery %, defect rate %, price trends, lead time, and payment terms. You can see which suppliers are actually adding value and which are costing you money through delays and quality issues.
This data also helps you negotiate. When you can show a supplier "Your defect rate is 6% vs. the industry average of 2%, and it's costing us ₹40,000/month in rework," they listen. You can also consolidate orders with your best suppliers to negotiate volume discounts.
One of our clients in Delhi NCR consolidated their supplier base from 18 to 12, negotiated 8–12% price reductions with top suppliers, and improved on-time delivery from 78% to 94%. Annual savings: ₹18 lakh.
Comparison Table: Custom Reports vs. Standard Dashboards
| Aspect | Standard ERP Dashboard | Custom Reports & Analytics |
|---|---|---|
| Data Sources | Single system only (e.g., Tally) | Multiple systems (ERP, IoT, accounting, inventory) |
| Update Frequency | Daily or weekly | Real-time or hourly |
| Industry-Specific KPIs | Generic (revenue, costs) | Manufacturing-specific (OEE, changeover time, scrap rate) |
| Drill-Down Capability | Limited | Deep (see headline, then drill to root cause) |
| Automated Alerts | None | Yes (downtime, quality, inventory thresholds) |
| Customization | Fixed fields | Built to your exact needs |
| Setup Time | Already in system | 4–8 weeks (one-time) |
| Monthly Cost | ₹0–₹2,000 (included) | ₹3,000–₹8,000 (depending on complexity) |
| ROI Timeline | N/A (no action possible) | 6–9 months |
Step-by-Step Guide: Building Custom Reports & Analytics for Your Factory
Tired of scattered spreadsheets and manual follow-ups?
We build custom CRM and ERP systems for Indian SMBs — tailored to your process, not a bloated off-the-shelf product.
Step 1: Map Your Data Sources
Start by listing everywhere your data lives. For most Indian manufacturers, this includes:
- ERP system (Tally, SAP, Odoo, custom software)
- Production machines (if IoT-enabled) or manual production logs
- Inventory management (separate system or within ERP)
- Accounting software
- Maintenance logs (digital or paper)
- Quality inspection records
- Supplier and customer databases
Don't worry if some data is still on paper or in Excel. We'll address that next.
Step 2: Identify Your Top 3 Pain Points
You can't measure everything. Start with the problems costing you the most money. For most manufacturers, it's one of these:
- Unplanned downtime
- Inventory holding costs
- Scrap and rework
- Late deliveries
- Margin erosion
Pick the top 3. We'll build reports for those first.
Step 3: Define KPIs and Metrics
For each pain point, define 2–3 KPIs. Examples:
For Downtime: OEE (Overall Equipment Effectiveness), mean time between failures (MTBF), mean time to repair (MTTR)
For Inventory: Inventory turnover ratio, days inventory outstanding (DIO), carrying cost as % of revenue
For Scrap: Scrap rate (%), rework cost as % of revenue, scrap by machine/operator/material
Write these down. These become your report specifications.
Step 4: Audit Your Data Quality
Before building reports, check if your data is clean. Common issues in Indian SMBs:
- Inconsistent date formats (DD/MM/YYYY vs. MM/DD/YYYY)
- Duplicate entries (same supplier listed 3 ways)
- Missing values (production logs with blank cells)
- Manual data entry errors
Spend 1–2 weeks cleaning your data. This is boring but critical. Bad data in = bad insights out.
Step 5: Build and Test Your First Report
Start with one report (e.g., daily production dashboard). Build it with 2–3 weeks of historical data, test it against reality, and refine it. Once it's working, add the next one.
Don't try to build all 7 reports at once. You'll get overwhelmed and lose focus.
Step 6: Set Up Alerts and Automation
Once your reports are live, set up alerts. Example:
- If OEE drops below 70%, send a Slack message to the production manager
- If inventory for a critical SKU falls below reorder point, send an email to procurement
- If scrap rate exceeds 6%, flag it for quality review
Automation turns reports into action.
Step 7: Review and Refine Monthly
Spend 30 minutes every month reviewing your reports. Ask:
- Are the metrics still relevant?
- Are we acting on the insights?
- What new metric should we add?
Reports aren't static. They evolve as your business does.
Common Mistakes to Avoid
Mistake 1: Building Too Many Reports at Once
You don't need 50 reports. You need 5–7 that matter. Start small, prove value, then expand. We've seen clients waste ₹3–4 lakh building reports nobody uses because they tried to do everything at once.
Mistake 2: Ignoring Data Quality
"We'll fix the data as we go" is a trap. Your reports will be garbage. Spend 2–3 weeks cleaning data upfront. It's worth it.
Mistake 3: Not Involving Your Team
Your production manager knows what matters. Your finance team knows what data is reliable. Your procurement team knows supplier pain points. Include them in the design process. Reports built without input from the people who use them get ignored.
Mistake 4: Choosing the Wrong Tool
You don't need enterprise software costing ₹50 lakh. Tools like Metabase, Looker, Power BI, or even custom Python dashboards work fine for Indian SMBs. Pick something your team can learn in a few days.
Mistake 5: Not Setting a Baseline
Before you implement custom reports, measure your current performance: scrap rate today, downtime today, inventory days today. Then measure 6 months later. Without a baseline, you can't prove ROI.
Mistake 6: Treating Reports as One-Time Projects
"We built the dashboard, now we're done." No. Reports require ongoing maintenance: updating data connections, refining metrics, training new team members. Budget for this.
This won't suit businesses with fewer than 10 staff or those still using entirely manual processes. You need at least some digital data to work with.
Key Takeaways
- Custom reports & analytics for manufacturing India consolidate scattered data into actionable insights, cutting costs by 15–40% within 12 months.
- The biggest wins come from reducing downtime (20–30%), optimizing inventory (₹2–5 lakh/year), and cutting scrap (10–25%).
- Start with your top 3 pain points, not all 7. Build one report, prove value, then expand.
- Speed matters: real-time data lets your team make decisions days earlier, which compounds into significant cost savings.
- Clean your data first. Garbage in = garbage out. Budget 2–3 weeks for data audit and cleanup.
- Involve your production, finance, and procurement teams in report design. They know what matters.
- Expect ROI within 6–9 months for most Indian SMBs. Track a baseline before you start.
- Setup takes 4–8 weeks. It's a one-time investment, then ₹3,000–₹8,000/month ongoing.
Frequently Asked Questions
Quick answers about custom reports analytics manufacturing india
01 How much will custom reporting software actually cost my mid-sized manufacturing unit? ›
A: You're looking at ₹40,000–₹1,20,000 annually for cloud-based analytics platforms like Zoho Analytics or Power BI, plus ₹15,000–₹30,000 for implementation and staff training. Most manufacturers see ROI within 6–8 months through waste reduction and inventory optimization alone — we've seen units cut material costs by 8–12% after the first quarter. If you're bootstrapping, start with free tools like Google Data Studio (₹0) and graduate to paid platforms once you've mapped your key cost drivers.
02 How long does it actually take to see cost savings after setting up custom reports? ›
A: You'll spot your first quick wins — like identifying slow-moving inventory or production bottlenecks — within 2–3 weeks of running baseline reports. Substantial savings (₹2–5 lakhs monthly for mid-sized units) typically materialize in 8–12 weeks once your team starts acting on the data insights, but this depends entirely on how disciplined you are about weekly data reviews and corrective actions. The manufacturers who see fastest results treat report analysis as a non-negotiable 90-minute Monday morning ritual.
03 Is custom analytics worth it if I'm running a smaller manufacturing operation with just 50–100 workers? ›
A: Absolutely — in fact, smaller units benefit more because your cost leakages are proportionally larger and easier to spot. A 50-person unit losing ₹50,000 monthly to raw material waste or machine downtime (which is typical) will recoup a ₹60,000 annual analytics investment in just 1.2 months. Start with 3–4 critical metrics (material cost per unit, machine utilization %, defect rate) rather than tracking 50 things — this keeps your setup lean and ROI obvious.
04 What's the biggest mistake SMB owners make with manufacturing analytics? ›
A: Collecting data without acting on it — we see this constantly. Owners spend ₹80,000 on fancy dashboards, then ignore alerts about rising scrap rates or energy spikes because they don't have a weekly review process. The real cost-cutting happens when you tie analytics to accountability — assign someone to investigate every red flag within 48 hours and track what you fixed. Units that implement this discipline cut costs 3–4x faster than those just monitoring passively.
05 What's the simplest way to get started without overwhelming my team? ›
A: Start with just your last 12 months of existing data (invoices, production logs, waste records) and plug it into a free Google Sheet or Zoho's free tier — don't wait for perfect systems. Identify your top 3 cost drivers (usually raw materials, energy, or scrap) and build one focused report showing weekly trends. After 4 weeks of this, you'll know whether to invest in formal software; most SMB owners realize they need it once they see how many ₹500–₹2,000 daily leaks they've been missing.
Need this built for your business?
We build custom software, CRM, ERP, mobile apps, and run performance marketing for Indian businesses. Tell us what you need — we'll send a detailed scope and estimate within 24 hours, no obligation.
- Free 30-min scoping call with our tech lead
- Detailed project estimate in writing
- No sales pitch — just honest advice on what makes sense
📞 +91 92794 55684 · 📧 [email protected] · Delhi NCR · PAN India
Innovaira's engineering team designs and builds custom software — CRM, ERP, SaaS platforms, web applications and mobile apps — for growing Indian businesses. ISO 9001:2015 certified for quality delivery.