7 Ways Indian Manufacturers Use Team Performance Dashboards to Cut Costs
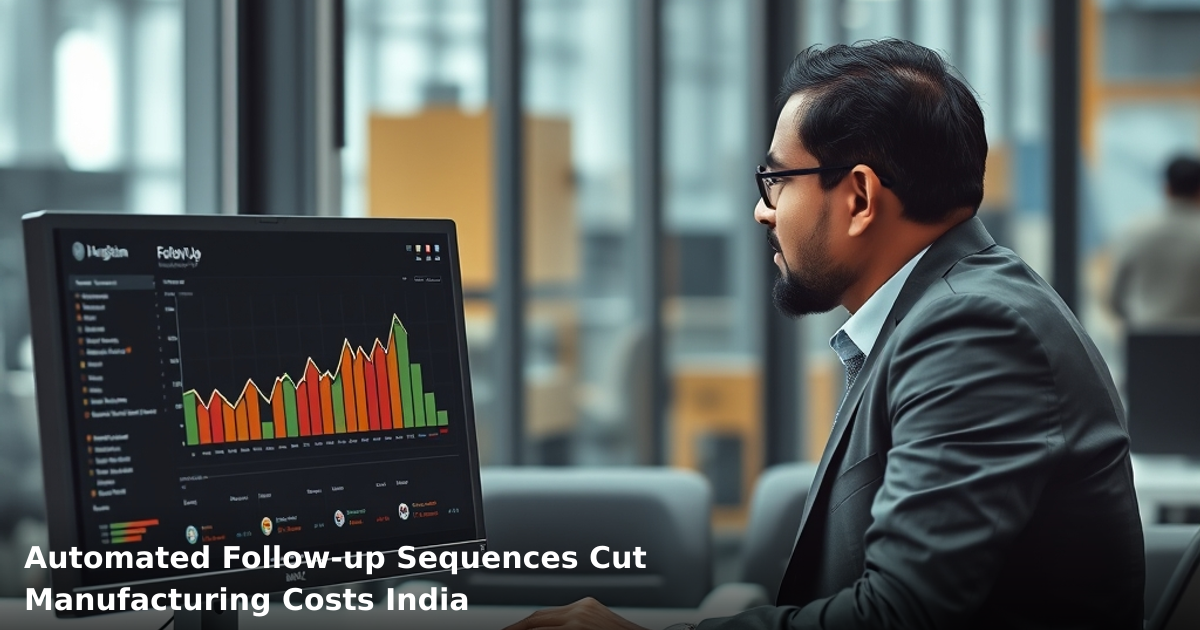
A team performance dashboard for manufacturing India isn't just a fancy screen that shows numbers. It's the difference between your production team running blind and actually knowing where money is leaking out of your operation.
We've worked with textile mills in Surat, automotive component suppliers in Pune, and food processing units in Nashik. The ones who installed dashboards cut waste by 18–35% within the first six months. The ones who didn't? They're still guessing.
Quick Answer: A team performance dashboard for manufacturing India tracks real-time metrics like output per worker, defect rates, machine downtime, and labour costs—helping you spot inefficiencies instantly. Indian manufacturers using these dashboards save ₹40,000–₹2,00,000 per month depending on factory size. Setup takes 3–4 weeks with the right ERP or custom system.
Why Team Performance Dashboards Matter for Indian Businesses
Your factory floor generates data every second. Machine cycles, worker attendance, quality checks, material waste, energy consumption. But if you're checking a spreadsheet once a week or relying on a supervisor's phone call, you're already 6 days behind.
According to a McKinsey study, manufacturers who use real-time performance tracking reduce operational costs by 12–18%. For Indian SMBs, that translates to ₹50,000–₹3,00,000 annually depending on your scale.
The problem? Most Indian manufacturers still use:
- Tally for accounting only (no real-time production data)
- WhatsApp groups for shift updates (scattered, untracked)
- Physical logbooks (lost, illegible, delayed)
- Excel sheets updated manually (errors, outdated by noon)
A team performance dashboard for manufacturing India consolidates all this into one screen your supervisor can check in 30 seconds.
What Happens Without Real-Time Visibility
One of our clients, a textile exporter in Tiruppur, was losing ₹1,80,000 per month to untracked downtime. Machines were stopping for 45 minutes here, an hour there. Nobody knew. The supervisor found out during the daily WhatsApp update. By then, the shift was over.
After installing a dashboard that flagged downtime in real-time, they caught the issue within 2 hours and cut unplanned downtime by 34%.
What Is a Team Performance Dashboard and How It Works
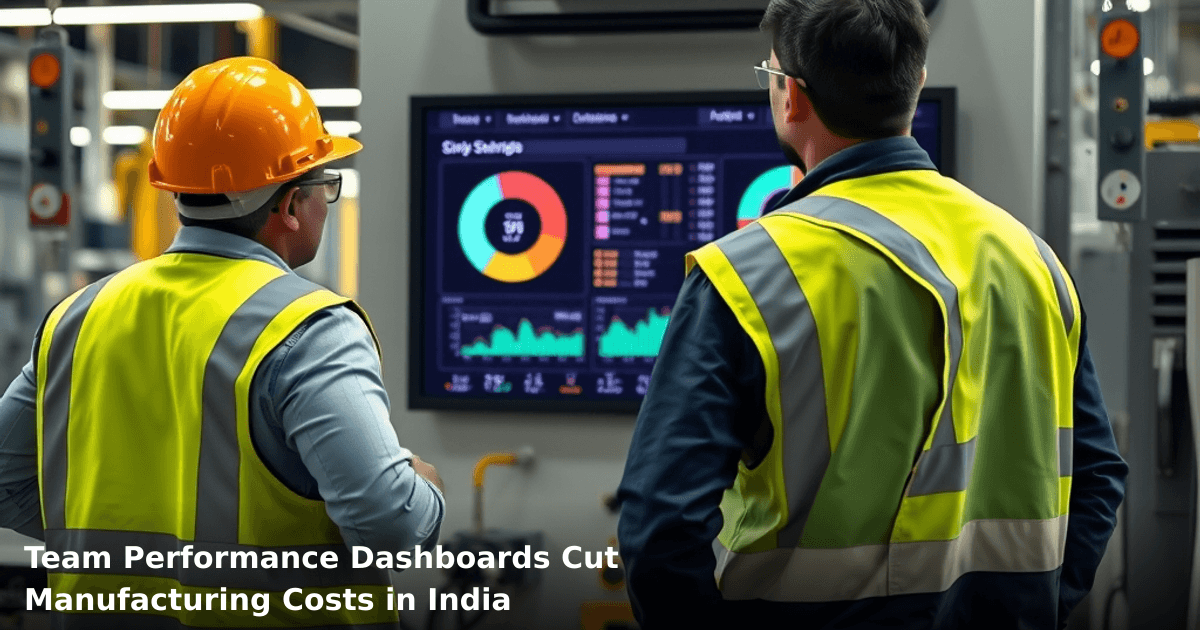
A team performance dashboard for manufacturing India is a live, centralized display of your factory's key metrics. Think of it as a control room screen, but accessible from your phone, laptop, or wall-mounted display.
It pulls data from:
- Your ERP system (production orders, inventory)
- IoT sensors on machines (uptime, temperature, cycles)
- Your attendance/payroll software
- Quality control logs
- Energy meters
Then it shows you:
- Output per shift, per worker, per machine
- Defect rates and scrap percentage
- Machine downtime (planned vs. unplanned)
- Labour productivity (units per hour per person)
- Energy consumption
- On-time delivery percentage
- Cost per unit produced
How It Cuts Costs: The Mechanism
Real-time spotting of waste. You see a machine is down. You fix it in 20 minutes instead of 4 hours.
Worker accountability. When output is tracked live, workers self-regulate. No need for a supervisor breathing down their neck. We've seen productivity jumps of 12–20% just from visibility.
Data-driven decisions. Instead of "I think we need another shift," you know exactly: "We're 8% short of target due to Machine #3 running at 70% efficiency."
Predictive maintenance. A dashboard can flag "Machine #2 temperature rising 5% above normal" before it breaks. Planned maintenance costs ₹15,000. Emergency breakdown costs ₹80,000 plus 8 hours of lost production.
7 Ways Indian Manufacturers Use Dashboards to Cut Costs
1. Reduce Unplanned Machine Downtime
The problem: A spinning frame stops. Nobody notices for 30 minutes. By then, you've lost 450 units of production.
The dashboard solution: Real-time alerts. The moment a machine stops, your supervisor gets a notification. They walk over, find a thread break, and restart in 5 minutes.
The math: Average unplanned downtime in Indian textile mills: 180–240 minutes per day. Cut that by 40% through faster response, and you save 72–96 minutes daily. At ₹800/minute of lost production, that's ₹57,600–₹76,800 per month.
One of our clients, a garment exporter in Tiruppur, reduced downtime alerts from 8 hours per week to 2 hours per week. Monthly saving: ₹1,20,000.
2. Optimize Labour Productivity and Shift Allocation
The problem: You don't know if your 15-person shift is doing the work of 15 people or 12.
The dashboard solution: Track output per worker per hour. You'll spot:
- Workers consistently below target (retraining needed, or wrong role)
- Peak performers (promote them, or ask what they're doing differently)
- Shift imbalances (maybe you need 12 on the morning shift, 10 on evening)
The math: One of our clients, a pharmaceutical packaging unit in Baddi, discovered that the evening shift was 18% less productive. Investigation revealed the quality checker was only working part-time. Adding a second checker cost ₹25,000/month but increased output by ₹2,10,000/month. Net gain: ₹1,85,000/month.
3. Cut Material Waste and Scrap Rates
The problem: You produce 1,000 units. 45 are defective. You scrap them. You don't know why or if it's preventable.
The dashboard solution: Track defect rates by:
- Machine
- Shift
- Worker
- Material batch
- Time of day
Patterns emerge. Machine #4 has a 6% defect rate, but Machine #2 has 2%. Why? Maybe Machine #4 needs calibration (costs ₹8,000, saves ₹40,000/month in scrap).
The math: A textile mill in Coimbatore reduced scrap from 4.2% to 2.8% by identifying that afternoon shifts had higher defect rates. Root cause: the quality checker took a late lunch. Rescheduling saved ₹95,000/month in scrap costs.
4. Monitor Energy Consumption and Reduce Utility Bills
The problem: Your electricity bill is ₹4,50,000/month. You have no idea which machines or processes consume the most.
The dashboard solution: IoT-enabled energy monitoring shows:
- kWh per machine per shift
- Peak consumption times
- Idle equipment still drawing power
The math: A food processing unit in Nashik discovered their refrigeration units were running 24/7, even during non-production hours. Installing a smart timer cut energy costs by ₹60,000/month. Dashboard visibility made the issue obvious.
5. Improve On-Time Delivery Through Real-Time Order Tracking
The problem: You promise delivery on the 15th. On the 12th, you realize you'll miss it because production is behind.
The dashboard solution: Track each order's progress in real-time:
- Order received (date)
- Raw material allocated
- Production start and current progress (% complete)
- Quality check status
- Packing and dispatch date
If an order is 2 days behind, you catch it on day 1 and adjust.
The math: Late deliveries cost you 2–5% of order value in penalties or credits. One of our clients, an automotive component supplier in Pune, improved on-time delivery from 87% to 96% using a dashboard. That 9% improvement meant ₹2,80,000 extra revenue per month (no penalties, no customer dissatisfaction).
6. Prevent Inventory Bloat and Reduce Working Capital
The problem: You're holding ₹30 lakh in raw material inventory. Half of it is slow-moving or obsolete.
The dashboard solution: Real-time inventory visibility shows:
- Stock levels by material type
- Days of inventory on hand (DIO)
- Slow-moving items (not touched in 30+ days)
- Expiry dates (for perishable materials)
You can then:
- Order just-in-time instead of hoarding
- Identify materials to return or liquidate
- Negotiate better payment terms with suppliers (faster turnover = better cash flow)
The math: A leather tannery in Chennai reduced inventory from ₹25 lakh to ₹16 lakh by using a dashboard to spot slow-moving stock. Released ₹9 lakh in working capital. At 12% cost of capital, that's ₹1,08,000 annual savings.
7. Enable Data-Driven Decisions Instead of Gut Feeling
The problem: Your manager says "We need to hire 2 more workers." Your accountant says "No, we can't afford it." Nobody has data.
The dashboard solution: You pull the dashboard and see:
- Current capacity utilization: 78%
- Output target: 1,200 units/day
- Current output: 1,050 units/day
- Gap: 150 units/day
- Per-worker output: 70 units/day
- Workers needed: 2.1 (so yes, hire 2)
The math: One of our clients, a rubber components manufacturer in Belgaum, used dashboard data to justify hiring. They hired 3 workers at ₹18,000/month each (₹54,000 total). Output jumped by ₹4,50,000/month. ROI: 733% in month 1.
Comparison Table: Dashboard Options for Indian Manufacturers
| Feature | Standalone Dashboard | ERP-Integrated Dashboard | Custom-Built Dashboard |
|---|---|---|---|
| Setup time | 1–2 weeks | 3–4 weeks | 4–6 weeks |
| Cost (one-time) | ₹1,50,000–₹3,00,000 | ₹3,00,000–₹8,00,000 | ₹5,00,000–₹15,00,000 |
| Monthly cost | ₹8,000–₹15,000 | ₹12,000–₹25,000 | ₹15,000–₹40,000 |
| Data sources | Limited (manual input) | Integrated with ERP | Fully customized |
| Real-time updates | 15–30 min delay | Live (1–2 sec) | Live (1–2 sec) |
| Mobile access | Yes | Yes | Yes |
| Scalability | Low | Medium | High |
| Best for | Small factories (<50 staff) | Mid-size units (50–200 staff) | Large factories (200+ staff) |
| Customization | Minimal | Medium | Unlimited |
If you're running a small textile unit with 20–30 workers, a standalone dashboard works. If you have an ERP (Tally, SAP, Oracle), integrate the dashboard into it. If you're a large automotive supplier with complex processes, build a custom dashboard.
Step-by-Step Guide for Indian SMBs
We build this automation for your business
Our team maps your current workflow, identifies automation opportunities, and delivers a working system in 2–3 weeks.
Step 1: Define Your Key Metrics (What to Track)
Don't track everything. Pick 8–12 metrics that directly impact your bottom line.
For a textile mill:
- Output per shift (units)
- Defect rate (%)
- Machine downtime (hours)
- Labour productivity (units/worker/hour)
- Energy consumption (kWh)
- Scrap percentage (%)
- On-time delivery (%)
- Cost per unit (₹)
For a food processing unit:
- Production capacity utilization (%)
- Batch yield (%)
- Quality rejects (%)
- Machine OEE (Overall Equipment Effectiveness)
- Labour cost per unit (₹)
- Inventory turnover (days)
- Packaging waste (%)
- Delivery delays (%)
Write these down. Get your team's input. Prioritize ruthlessly.
Step 2: Audit Your Current Data Sources
Where does your data live today?
- Tally: Inventory, accounts, but not real-time production
- WhatsApp groups: Shift updates (unstructured, hard to analyze)
- Logbooks: Attendance, downtime (manual, delayed)
- Excel sheets: Whatever someone last updated
- IoT sensors: If you have them (most Indian SMBs don't yet)
- Quality control forms: Physical or PDF
List all sources. Identify gaps. This determines whether you can build a dashboard or if you need to add sensors/software first.
Step 3: Choose Your Dashboard Platform
Option A: Standalone dashboard tool
- Examples: Metabase, Grafana, Tableau Public
- Cost: ₹1,50,000–₹3,00,000 setup + ₹8,000–₹15,000/month
- Best if: You have data sources already in place
- Time: 1–2 weeks
Option B: ERP-integrated dashboard
- If you use Tally, SAP, or Oracle, ask your vendor about built-in dashboards
- Cost: ₹3,00,000–₹8,00,000 setup + ₹12,000–₹25,000/month
- Best if: You want real-time ERP data + production data
- Time: 3–4 weeks
Option C: Custom-built dashboard
- Hire a developer or agency (like Innovaira) to build exactly what you need
- Cost: ₹5,00,000–₹15,00,000 setup + ₹15,000–₹40,000/month
- Best if: You have complex processes or specific requirements
- Time: 4–6 weeks
If your current setup is fragmented (Tally + WhatsApp + logbooks), a custom dashboard that pulls data from all sources and displays it centrally is worth the investment. Our ERP Development service can help consolidate your data sources and build a dashboard on top.
Step 4: Set Up Data Collection (Manual or Automated)
Manual (low-tech, but works):
- Supervisor logs shift output in a simple form (Google Form or paper template)
- Quality checker records defects in a logbook
- You manually input into the dashboard tool
Cost: ₹0 (use what you have) Delay: Data is 2–4 hours old Best for: Very small factories or pilot phase
Semi-automated (recommended for most SMBs):
- IoT sensors on key machines (cost: ₹25,000–₹80,000 per sensor)
- Barcode scanning for inventory (cost: ₹15,000–₹40,000)
- Mobile app for attendance (cost: ₹30,000–₹60,000)
- Data feeds into a central database
- Dashboard pulls live data
Cost: ₹1,50,000–₹3,00,000 (sensors + software) Delay: Real-time (1–2 seconds) Best for: Most Indian manufacturers
Fully automated (ideal, but expensive):
- All machines connected to IoT
- Quality checks via computer vision
- Inventory via RFID
- Everything feeds into a cloud database
- Dashboard is live 24/7
Cost: ₹5,00,000–₹20,00,000+ Delay: Real-time Best for: Large factories or export-focused units
Start with semi-automated. Upgrade as you grow.
Step 5: Train Your Team and Go Live
This is where most dashboards fail. Your supervisor doesn't know how to read it. Your manager ignores it. It becomes a shiny screen nobody uses.
Training checklist:
- Show supervisors how to interpret the dashboard (45 minutes)
- Explain what actions to take based on alerts (30 minutes)
- Set up daily 5-minute standup meetings to review the dashboard (starting tomorrow)
- Assign one person as the "dashboard owner" (responsible for troubleshooting, updates)
- Create a simple SOP: "If defect rate goes above 3%, do X"
Go-live best practice:
- Start with one shift or one production line
- Run parallel with your old system for 1 week
- Gather feedback
- Expand to the full factory
Step 6: Review Weekly, Optimize Monthly
Weekly review (15 minutes):
- Are alerts triggering correctly?
- Is data accurate?
- Any technical issues?
Monthly deep-dive (1 hour):
- What metrics improved? Why?
- What metrics got worse? Why?
- What actions did the dashboard trigger?
- What's the ROI so far?
- What should we track next?
Quarterly optimization (half-day):
- Are we measuring the right things?
- Should we add or remove metrics?
- Is the dashboard still aligned with business goals?
Common Mistakes to Avoid
Mistake 1: Tracking Too Many Metrics
You add 40 metrics to the dashboard. Your supervisor spends 2 hours reading it. Nobody acts on the data.
Fix: Start with 8–10 metrics. Add more only if you have a specific reason. Quality > quantity.
Mistake 2: Not Connecting Data to Action
The dashboard shows "Defect rate is 5%." Then what? Nobody knows.
Fix: For every metric, define the action trigger. "If defect rate > 4%, pause production and inspect Machine #2." Make it a rule, not a suggestion.
Mistake 3: Ignoring Data Quality
Your dashboard looks great, but the numbers are wrong because data entry is sloppy.
Fix: Audit your data sources. If manual entry, make it foolproof (dropdowns, not free text). If automated, test the sensors. Garbage in = garbage out.
Mistake 4: Treating the Dashboard as a Reporting Tool Only
You use it to report to the owner on Friday. The rest of the week, nobody looks at it.
Fix: Make it operational. Use it for daily decisions: "Should we run overtime tonight?" Check the dashboard. "Is Machine #3 worth repairing or should we replace it?" Check the dashboard.
Mistake 5: Over-Investing in Technology Too Early
You're a 30-person textile mill. You spend ₹12 lakh on a fancy custom dashboard with AI and predictive analytics. You can't maintain it. It breaks. You abandon it.
Fix: Start simple. Standalone dashboard or ERP integration. Prove ROI. Then upgrade.
Mistake 6: Not Training Your Team
You install the dashboard. Your supervisor doesn't know how to read it. It sits unused.
Fix: Invest in training. Have the vendor/developer spend a full day with your team. Create a simple user guide (1 page, in Hindi if needed). Assign an owner.
Key Takeaways
- A team performance dashboard for manufacturing India gives you real-time visibility into production, quality, labour, and costs—letting you spot inefficiencies and act within minutes instead of days.
- Indian manufacturers using dashboards typically save ₹40,000–₹2,00,000 per month through reduced downtime, lower scrap, optimized labour, and better inventory management.
- Start with 8–10 key metrics that directly impact your bottom line. Don't track everything.
- Semi-automated data collection (IoT sensors + mobile apps) costs ₹1,50,000–₹3,00,000 but gives you real-time data. Manual data entry is cheaper upfront but delays decisions.
- The dashboard is only useful if your team acts on it. Train them. Make it operational. Review it weekly.
- ROI typically shows up within 2–3 months. One of our clients saw ₹1,80,000/month in savings from downtime reduction alone.
- Choose the right platform: standalone for small factories, ERP-integrated for mid-size, custom-built for large or complex operations.
Frequently Asked Questions
Quick answers about team-performance-dashboard-manufacturing-india
01 How much will implementing a team performance dashboard cost my manufacturing unit? ›
A: You're looking at ₹15,000–₹50,000 monthly for a mid-sized operation (50–200 workers), depending on whether you choose cloud-based SaaS tools like Tableau/Power BI or custom builds. Most Indian manufacturers see ROI within 4–6 months through reduced downtime tracking and real-time bottleneck identification—one Pune-based auto-parts maker saved ₹8.5 lakhs annually just by cutting unplanned stoppages by 18% after dashboard implementation. Smaller units (under 50 workers) can start with basic ₹5,000–₹8,000/month tools that integrate with existing ERP systems.
02 How long does it actually take to get a dashboard up and running on our shop floor? ›
A: Basic deployment takes 6–8 weeks if you're connecting existing systems; full integration with real-time IoT sensors can stretch to 12–16 weeks. The real timeline killer isn't the software—it's data cleanup and training your supervisors, which typically takes 3–4 weeks. I've seen manufacturers in Bangalore go live in 4 weeks by starting with just 2–3 KPIs (line efficiency, defect rate, OEE) instead of trying to track everything at once.
03 Is a performance dashboard actually useful for a small 40-person manufacturing workshop? ›
A: Absolutely, but you need to right-size it—a 40-person workshop shouldn't replicate what a 500-person factory does. Focus on 3–4 critical metrics (machine utilization, scrap %, cycle time) rather than 20. A small precision engineering unit in Bangalore with 35 workers reduced their lead time by 22% and scrap costs by ₹2.1 lakhs quarterly just by tracking real-time machine idle time on a simple dashboard—no complex setup needed.
04 What's the biggest mistake Indian manufacturers make with performance dashboards? ›
A: They treat dashboards as a reporting tool instead of an action tool—executives check charts monthly but don't act on bottlenecks weekly. The real cost-cutting happens when your floor supervisor sees a line running at 62% efficiency at 10 AM and fixes it by noon, not when the manager reviews it in next month's meeting. Dashboards without accountability and daily huddles tied to the metrics deliver maybe 5–8% cost savings; those with daily action loops achieve 18–25% improvements within a year.
05 What's the first step if we want to start using dashboards but have zero experience? ›
A: Start by auditing your current data sources—check if your ERP, MES, or even Excel sheets already capture machine hours, defects, and production targets. Most Indian SMBs already have 60–70% of the data they need; they just don't connect it visually. Pick one high-pain area (like recurring line stoppages costing you ₹1.5 lakhs monthly) and build your first dashboard around just that—then expand after 6–8 weeks once your team sees the impact and trusts the numbers.
Need this built for your business?
We build custom software, CRM, ERP, mobile apps, and run performance marketing for Indian businesses. Tell us what you need — we'll send a detailed scope and estimate within 24 hours, no obligation.
- Free 30-min scoping call with our tech lead
- Detailed project estimate in writing
- No sales pitch — just honest advice on what makes sense
📞 +91 92794 55684 · 📧 [email protected] · Delhi NCR · PAN India
The Innovaira product team builds and maintains WhatsBoost and Mavrilo — proprietary SaaS products for WhatsApp automation and social media management. ISO 27001:2022 certified for information security.