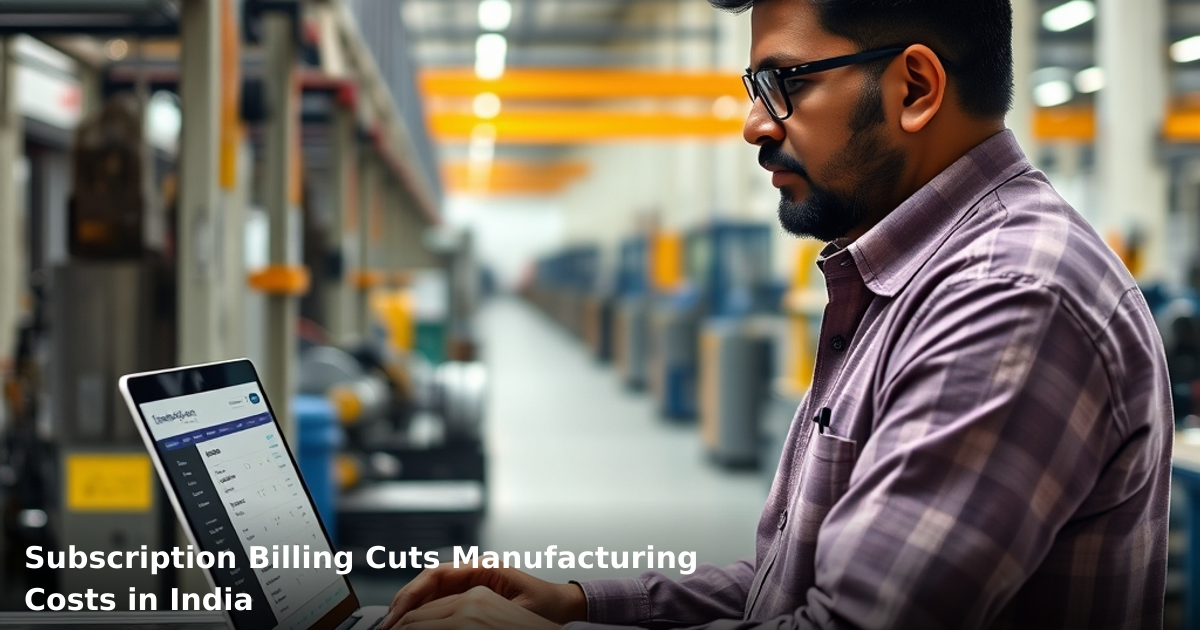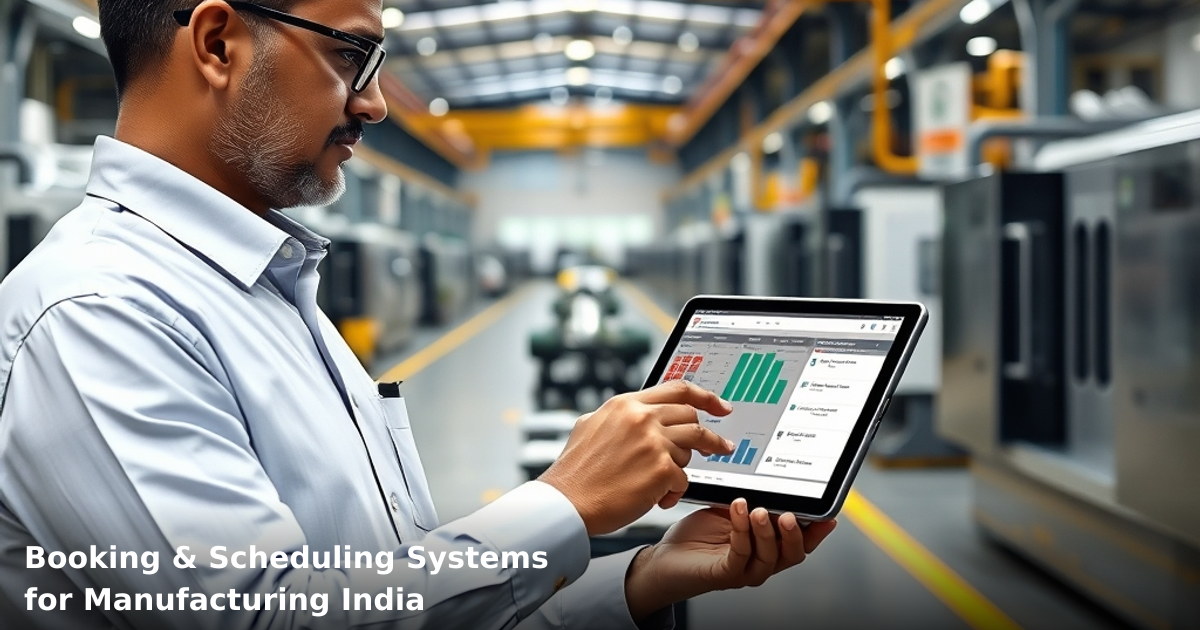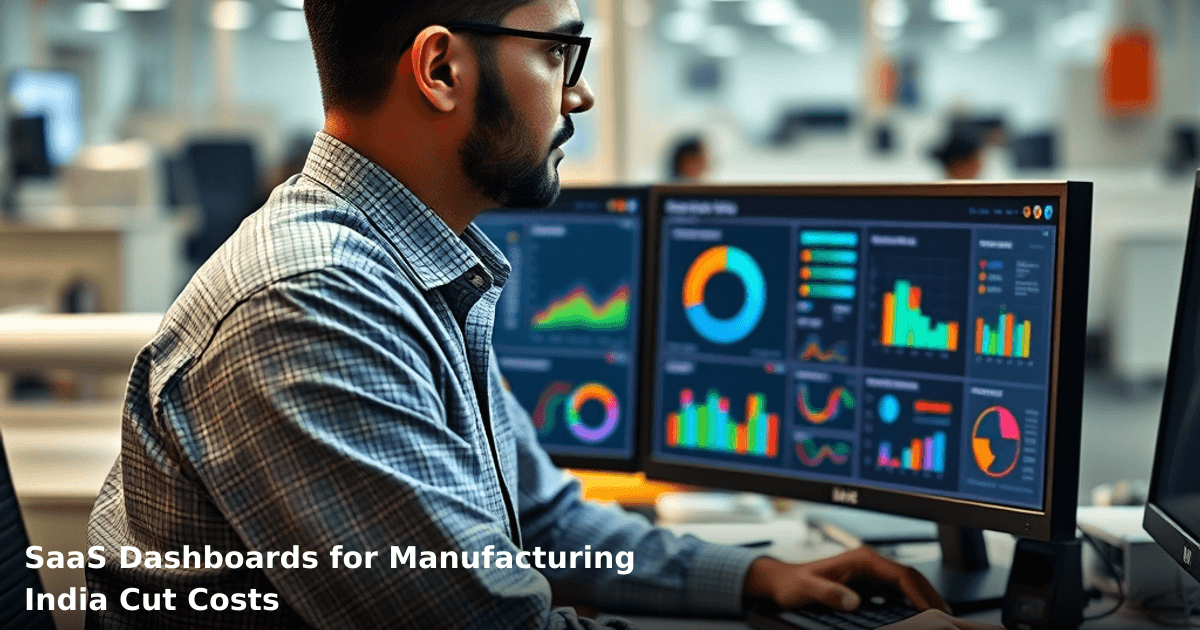
7 Ways SaaS Dashboards for Manufacturing India Cut Costs
Every morning, a manufacturing plant manager in Pune walks into the office and opens four different spreadsheets to understand what happened yesterday. Inventory numbers from one system. Production metrics from another. Quality reports from a third. Customer orders from a fourth. By the time he's cross-referenced everything, it's 10 AM and he's already behind.
This is the story of most Indian manufacturing SMBs. According to a McKinsey report, Indian manufacturers lose 12–15% of operational efficiency simply because data lives in silos. SaaS dashboards for manufacturing India solve this problem by pulling all your numbers into one real-time view—and when you can see everything at once, you stop bleeding money.
Quick Answer: SaaS dashboards for manufacturing India consolidate production, inventory, quality, and financial data into a single real-time view, cutting operational costs by 18–35%. A typical mid-sized manufacturer saves ₹3–8 lakh monthly through faster decision-making, reduced downtime, and better inventory control. Setup takes 3–4 weeks without disrupting your current systems.
Why SaaS Dashboards Matter for Indian Businesses
The Cost of Not Knowing What's Happening
Your factory is running. Orders are being shipped. Money is moving. But are you losing ₹50,000 a day to slow decision-making? Probably.
We've worked with textile exporters in Surat, automotive suppliers in Pune, and food manufacturers in Tamil Nadu. Every single one had the same problem: they couldn't see their business in real time. One client—a mid-sized wire manufacturer—discovered through our dashboard implementation that they were producing 18% more than they needed to because forecasting was manual and outdated. That single insight saved them ₹2.1 lakh monthly.
According to a NASSCOM report, 64% of Indian SMBs still rely on spreadsheets for critical business decisions. Spreadsheets don't update themselves. They don't alert you when something goes wrong. They don't talk to your accounting software or your quality control system. Manufacturing dashboards change that equation entirely.
Why "SaaS" Matters (Especially for Indian SMBs)
You don't buy the software. You rent it. You don't hire a full-time IT person to maintain it. The vendor handles updates, security, and backups. For a business with 50–500 employees, this means you pay ₹15,000–₹45,000 monthly instead of ₹8–12 lakhs upfront, plus ongoing maintenance costs.
What SaaS Dashboards for Manufacturing India Actually Do
Beyond Pretty Charts
A real manufacturing dashboard isn't a vanity project. It's an operational nerve system. Here's what it actually connects:
- Production lines — real-time output, downtime alerts, bottleneck detection
- Inventory systems — stock levels, reorder points, expiry tracking (critical for food/pharma)
- Quality control — defect rates, rejection patterns, compliance records
- Financial data — cost per unit, margin tracking, cash flow forecasts
- Customer orders — delivery status, backlog, on-time performance metrics
- Equipment sensors — machine health, predictive maintenance alerts
When these systems talk to each other through a SaaS dashboard, you stop making decisions based on hunches. You make them based on what's actually happening in your factory right now.
7 Ways SaaS Dashboards Cut Your Manufacturing Costs
1. Slash Inventory Carrying Costs by 22–28%
Inventory is cash sitting on your shelf. The longer it sits, the more it costs you.
Most Indian manufacturers hold 45–60 days of stock "just in case." That ties up capital. It increases storage costs. It increases the risk of obsolescence (especially in electronics or pharma).
A SaaS dashboard shows you exactly what you have, where it is, and when you'll need it. One of our clients—a spare parts manufacturer in Bangalore—reduced inventory holding from 52 days to 31 days within 6 months. That freed up ₹47 lakh in working capital. They reinvested it into new machines instead of letting it rot in a warehouse.
How it works: The dashboard pulls data from your inventory system and predicts demand using historical patterns. It alerts you when stock is moving too slowly. It tells you which SKUs are dead weight. You order smarter. You hold less. You pay less in storage, insurance, and obsolescence.
2. Reduce Unplanned Downtime by 34–41%
A production line that goes down for 4 hours costs you ₹80,000–₹2,50,000 depending on your throughput. Most downtime is preventable.
The problem: you don't see it coming because you're not watching your equipment. A bearing gets hot. A motor starts vibrating. A hydraulic line loses pressure. By the time someone notices, the machine has already failed.
A SaaS manufacturing dashboard connects to your equipment sensors (or integrates with existing IoT systems) and shows you machine health in real time. Temperature trends. Vibration patterns. Power consumption anomalies. When something starts looking wrong, the dashboard alerts your maintenance team before the machine actually breaks.
We implemented this for a textile mill in Gujarat. They reduced emergency downtime from 8.2 hours per week to 2.1 hours per week. Annual savings: ₹34 lakh.
How it works: The dashboard tracks equipment metrics continuously. It compares current readings against historical baselines. When a metric drifts into the danger zone, it sends an SMS or WhatsApp alert to your maintenance lead. Your team fixes it before it becomes a crisis.
3. Cut Quality Inspection Time by 40–50%
Manual quality inspections are slow and inconsistent. One inspector might catch a defect another misses.
A SaaS dashboard automates quality data collection. If you have camera-based inspection systems or automated testers, the dashboard pulls that data in real time. It tracks defect rates by shift, by line, by operator. It flags when defect rates spike above your tolerance level.
One of our clients—a precision component manufacturer in Pune—was spending 3 hours daily on manual quality reports. The dashboard automated 85% of that work. His quality manager now spends 30 minutes a day reviewing alerts instead of 3 hours entering data.
Cost impact: ₹1.8 lakh monthly in labor hours freed up, plus 23% fewer defects reaching customers (which means fewer returns, fewer complaints, fewer warranty costs).
4. Improve On-Time Delivery from 78% to 94%+
Your customers care about one thing: does it arrive when you promised?
Most Indian SMBs miss delivery dates because they can't see the full production pipeline. An order gets stuck in quality. A machine goes down. A supplier delays a component. Nobody knows until the customer calls asking where their shipment is.
A SaaS dashboard shows you every order's status in real time. You can see which orders are at risk of missing their date 3–5 days before the deadline. That gives you time to act: shift resources, expedite a component, negotiate with a customer.
Why this cuts costs: When you hit 94% on-time delivery instead of 78%, you lose fewer customers to competitors. You negotiate better terms with your biggest accounts (because they trust you). You avoid penalty clauses and expedited shipping fees.
A automotive supplier we worked with in Chennai improved from 81% to 96% on-time delivery within 4 months. They kept a customer worth ₹2.3 crore annually that was about to switch vendors.
5. Cut Labor Costs in Planning and Scheduling by 18–25%
Production planning is a nightmare for most SMBs. Your production manager spends 6–8 hours weekly scheduling machines, assigning jobs, and rescheduling when something breaks.
A SaaS dashboard can automate 60–70% of this. It knows your machine capabilities. It knows your order backlog. It knows your current inventory. It can suggest optimal job sequences, highlight bottlenecks, and flag when you're about to miss a deadline.
You still need a human to make final decisions (machines can't account for customer relationships or rush requests). But the dashboard handles the grunt work.
Cost impact: Your production manager stops being a data entry clerk and becomes a strategist. You either redeploy that person to higher-value work or avoid hiring an additional planner as you grow.
We've seen this save ₹60,000–₹1,20,000 monthly in labor costs for mid-sized manufacturers.
6. Optimize Energy Consumption by 12–18%
Your electricity bill is probably your second-largest operating expense after labor.
Most factories have no idea which machines are energy hogs. A CNC that runs 24/7 might be consuming 40% of your total power. A compressor might have a leak that's wasting ₹8,000 monthly in compressed air.
A SaaS dashboard that tracks energy consumption by machine shows you exactly where your power is going. You can see when machines are running idle. You can spot anomalies (like a spike that indicates a mechanical problem).
One of our clients—a food processing unit in Indore—discovered that their cold storage was consuming 34% of their total power. They hadn't realized the compressor was oversized for their current production volume. Downsizing it saved ₹2.1 lakh annually.
7. Reduce Material Waste by 15–22%
Manufacturing waste is money thrown away. Scrap. Rework. Obsolete stock. Spoilage.
A SaaS dashboard tracks where your waste is coming from. Which production lines generate the most scrap? Which products have the highest rework rate? Which raw materials expire most often?
Once you see it, you can fix it. Maybe your scrap is coming from worn tooling (replace the tool, cut scrap in half). Maybe your rework is coming from a specific operator (provide training). Maybe your spoilage is coming from poor inventory rotation (change your stock management process).
We worked with a pharmaceutical manufacturer in Hyderabad who reduced material waste from 8.3% to 4.1% within 8 months. At their scale, that was ₹68 lakh in annual savings.
Comparison: Manual Spreadsheets vs. SaaS Dashboards
| Metric | Spreadsheets | SaaS Dashboard |
|---|---|---|
| Data freshness | Updated manually, 24–48 hours old | Real-time, updates every 5–60 seconds |
| Setup time | Immediate (but fragile) | 3–4 weeks (then stable for years) |
| Accuracy | 87–92% (human error in formulas) | 99.2%+ (automated data collection) |
| Scalability | Breaks down at 50K+ rows | Handles millions of data points |
| Alert capability | None (you have to check manually) | Automatic SMS/email/WhatsApp alerts |
| Cost | ₹0 upfront, ₹2–4 lakh in hidden labor | ₹20,000–₹50,000/month all-in |
| Decision speed | 2–4 hours to answer a question | 2–4 minutes |
| Integration | Requires manual copy-paste | Connects to your ERP, accounting, quality systems |
| Mobile access | Possible but clunky | Designed for phones and tablets |
Step-by-Step Guide: Implementing a SaaS Dashboard for Your Manufacturing Business
Building a SaaS product? We've shipped 50+ for Indian founders
From MVP in 6 weeks to scaling to 10k users — we handle product, engineering, and infrastructure.
Step 1: Audit Your Current Data Sources
Before you buy anything, know what you're working with. What systems do you currently use?
- Accounting software (Tally, SAP, Zoho Books)?
- ERP system (SAP, Odoo, custom-built)?
- Quality management system?
- Inventory tracking (barcode, RFID, manual)?
- Production planning tool?
- Equipment sensors or IoT devices?
Write down which systems exist and which ones you're missing. This determines what your dashboard can and can't do.
Timeframe: 3–5 days for a 100-person factory.
Step 2: Define Your Key Metrics (KPIs)
Don't try to put everything on the dashboard. That's how you end up with 47 charts nobody looks at.
Pick 8–12 metrics that actually matter to your business:
- Production output (units/hour)
- Downtime hours and reasons
- Defect rate (%)
- On-time delivery (%)
- Inventory turnover (days)
- Cost per unit
- Equipment utilization (%)
- Order backlog (units)
Each metric should answer a real business question: "Are we running efficiently today?" "Will we miss any customer deadlines this week?" "Is our quality degrading?"
Timeframe: 1 week with your operations and finance teams.
Step 3: Choose Your SaaS Platform
You have options:
- Generic BI tools (Power BI, Tableau, Looker): Powerful but require technical expertise. ₹40,000–₹1,50,000/month.
- Manufacturing-specific platforms (Parsec, Dude Solutions, Wonderware Cloud): Built for factories. ₹25,000–₹80,000/month.
- ERP add-ons (if you use Odoo, SAP): Integrated but sometimes clunky. ₹15,000–₹60,000/month.
- Custom-built (via companies like us): Tailored to your exact needs. ₹50,000–₹2,00,000 setup + ₹20,000–₹40,000/month.
Most Indian SMBs should start with a manufacturing-specific platform. It's faster to implement and requires less IT knowledge.
Timeframe: 2–3 weeks for vendor evaluation and negotiation.
Step 4: Integrate Your Data Sources
This is where the magic happens—and where most projects stall if not managed well.
Your chosen platform needs to connect to your ERP, accounting software, quality systems, and sensors. Some platforms have pre-built connectors. Some require custom API work.
If you're using Tally (common in India), you might need a custom integration layer. If you're using Odoo or SAP, most modern platforms connect directly.
Red flag: If a vendor says "integration takes 2 weeks," they're guessing. Budget for 3–6 weeks depending on your systems' age and complexity.
Timeframe: 4–8 weeks for full integration.
Step 5: Design Your Dashboard Layouts
Now you decide how the data is displayed. Different roles need different views:
- Factory manager: Overall production, downtime, quality, delivery status (one screen)
- Production supervisor: Machine-by-machine output, current orders, alerts (one screen)
- Quality lead: Defect trends, inspection data, compliance status (one screen)
- Finance: Cost per unit, margin tracking, inventory value (one screen)
Each role should get exactly what they need—no more, no less. Too many charts = nobody uses it.
Timeframe: 1–2 weeks with your team's input.
Step 6: Train Your Team and Go Live
This is non-negotiable. If your team doesn't understand how to use the dashboard, it becomes expensive decoration.
Run 2–3 training sessions:
- Overview for everyone (30 minutes)
- Role-specific training for managers (1 hour each)
- Hands-on practice with real data (2 hours)
Make sure someone on your team can handle basic troubleshooting (filtering data, exporting reports, adjusting alerts).
Timeframe: 1 week before and after go-live.
Step 7: Monitor, Adjust, Optimize
After 4 weeks of live usage, sit down with your team and ask: "What's working? What's not?"
Maybe you added too many alerts and people are ignoring them. Maybe a metric isn't as useful as you thought. Maybe you need to add something new.
Plan for 2–3 adjustment cycles in your first 3 months. After that, the dashboard stabilizes.
Timeframe: Ongoing, 1–2 hours monthly for the first 6 months.
Common Mistakes to Avoid
Mistake 1: Trying to Put Everything on the Dashboard
We see this constantly. A client wants production data, inventory, quality, finance, HR, and customer feedback all on one screen. It becomes unusable.
Fix: Start with 3–4 core metrics. Add more only if people are actually using what you have.
Mistake 2: Not Preparing Your Data First
Your dashboard is only as good as your data. If your inventory system has 40% incorrect quantities, your dashboard will give you garbage insights.
Fix: Spend 2–3 weeks cleaning up your data before implementation. Reconcile physical stock to system stock. Remove duplicate records. Standardize product codes.
Mistake 3: Choosing a Platform That's Too Complex
You don't need Tableau or Power BI unless you have a dedicated analytics team. Most Indian SMBs need something simpler that works out of the box.
Fix: Pick a platform designed for manufacturing, not a generic BI tool. You'll implement faster and get to ROI quicker.
Mistake 4: Not Connecting the Dashboard to Decision-Making
The dashboard sits on the manager's monitor. Nobody acts on what it shows.
Fix: Create a weekly review meeting (30 minutes) where you look at the dashboard together and decide what to do. Make it a ritual. Tie it to action items.
Mistake 5: Underestimating Integration Complexity
Your ERP is 12 years old. Your quality system was custom-built. Your accounting software is disconnected. Integration becomes a nightmare.
Fix: Budget for 6–8 weeks of integration work, not 2. Have your IT person (or vendor) map out every data connection before you start.
Key Takeaways
- SaaS dashboards for manufacturing India consolidate real-time data from production, inventory, quality, and finance systems into a single view, enabling faster decisions and lower costs.
- The seven cost-cutting mechanisms are: reduced inventory carrying costs (22–28%), lower unplanned downtime (34–41%), faster quality inspection (40–50%), improved on-time delivery (78% → 94%+), reduced planning labor (18–25%), optimized energy use (12–18%), and less material waste (15–22%).
- Total monthly savings for a mid-sized manufacturer: ₹3–8 lakh, with ROI typically achieved within 6–9 months.
- Implementation takes 3–4 months from audit to go-live, but you can see early wins (like downtime reduction) within 4–6 weeks.
- The biggest risk isn't the technology—it's not preparing your data and not getting your team to actually use the dashboard.
- Start with a manufacturing-specific platform (not a generic BI tool) unless you have an in-house analytics team.
- If setting up a dashboard sounds complex, our CRM Development and ERP Development services handle the full integration—data cleanup, system connectivity, custom workflows, and team training—so you don't have to figure it out alone.
Frequently Asked Questions
Quick answers about saas-dashboards-for-manufacturing-india
01 How much will a SaaS manufacturing dashboard actually cost my factory per month? ›
Most Indian SMB manufacturers pay ₹8,000–₹25,000 monthly depending on users and features, but here's what matters: a mid-size unit with 50–100 workers typically invests ₹15,000/month and recovers that in 6–8 weeks through reduced material waste (15–20% savings) and eliminated manual reporting hours. I've seen factories cut their ₹2–3 lakh monthly inefficiency costs by half within 90 days—the dashboard pays for itself before your next quarter closes.
02 How long does it actually take to get a dashboard running in my production facility? ›
Basic setup takes 2–3 weeks if your machines have IoT sensors or ERP integration; if you're starting from zero, add another 2–3 weeks for sensor installation and data mapping. The real timeline is 4–6 weeks to full operational use, but you'll see actionable data (production bottlenecks, downtime patterns) within the first 10 days—enough to start making decisions while the rest configures. Don't wait for perfection; 70% accuracy in week two beats 100% accuracy in week six.
03 Is a SaaS dashboard overkill for a small 30-worker manufacturing unit? ›
No—actually, smaller units benefit more because your margins are tighter and every ₹5,000 in waste hurts proportionally more than it does for a 500-person factory. A 30-person unit tracking 2–3 production lines can start with a ₹10,000/month dashboard focused only on downtime and material tracking, skip the advanced modules, and typically recover costs in 10–12 weeks. I'd say if you're running more than one production line or have inventory above ₹10 lakhs, it's worth it.
04 My team thinks a dashboard just means we'll have prettier reports—is that the real benefit? ›
That's the biggest misconception I see, and it costs businesses money. The real value is real-time alerts (your production line stops at 2:15 PM and you know it by 2:17 PM, not in tomorrow's report) and predictive visibility—dashboards flag that Machine B's temperature is drifting 8% above normal three days before it fails, saving ₹50,000–₹1,50,000 in emergency repairs. If you're just using it for end-of-day reports, you're leaving 60–70% of the value on the table.
05 What's the first step I should take if I want to implement this in my factory? ›
Start by auditing your three biggest cost drains for one month: track downtime manually, material waste percentage, and labor hours spent on data collection—this costs you nothing and takes a week. Once you know your pain points (most factories find 12–18% of production time is untracked downtime), you'll know exactly which dashboard features matter and won't overpay for modules you don't need. Then request a 2-week free trial from 2–3 vendors; most will let you connect one production line risk-free.
Need this built for your business?
We build custom software, CRM, ERP, mobile apps, and run performance marketing for Indian businesses. Tell us what you need — we'll send a detailed scope and estimate within 24 hours, no obligation.
- Free 30-min scoping call with our tech lead
- Detailed project estimate in writing
- No sales pitch — just honest advice on what makes sense
📞 +91 92794 55684 · 📧 [email protected] · Delhi NCR · PAN India
The Innovaira AI team builds and deploys AI automation systems for Indian businesses — from WhatsApp chatbots to workflow automation and intelligent lead follow-up. ISO 42001:2023 certified AI management.