Best Heatmap Analysis Company in Hyderabad: How to Choose
If your e-commerce store in Hyderabad gets 10,000 monthly visitors but only 2% convert, you're leaving money on the table. The problem? You can't see where those visitors are actually clicking, scrolling, or abandoning. That's where heatmap analysis in Hyderabad, India comes in—and choosing the right partner can mean the difference between guessing and knowing.
Quick Answer: Heatmap analysis shows you exactly where users click, scroll, and move on your website using visual maps. In Hyderabad, expect to pay ₹15,000–₹50,000/month for professional heatmap services combined with actionable insights. The best companies don't just show heat maps—they interpret the data and recommend specific changes that typically improve conversion rates by 15–35% within 2–3 months.
Why Heatmap Analysis Matters for Indian Businesses
The Real Cost of Not Knowing User Behavior
You've probably spent ₹2–10 lakhs on your website. You've optimized for SEO, maybe even run Google Ads. But if you don't know why visitors aren't converting, you're throwing money at a problem you can't see.
A NASSCOM report found that 58% of Indian SMBs redesign their websites without data—and 62% of those redesigns fail to improve conversions. Heatmap analysis in Hyderabad, India solves this by giving you actual user behavior data, not assumptions.
We've worked with a textile exporter in Tiruppur who had a product page with a confusing checkout flow. Heatmap data showed that 73% of users clicked on a non-clickable image instead of the "Add to Cart" button. One layout change, based on that heatmap, increased their conversion rate from 1.8% to 4.2% in 30 days. That's ₹3.5 lakhs in extra revenue per month.
Where Heatmaps Work Best
Heatmap analysis works for:
- E-commerce sites (product pages, checkout flows)
- SaaS platforms (onboarding, feature discovery)
- Real estate portals (property listings, inquiry forms)
- Lead generation sites (form placement, CTA visibility)
- B2B websites (pricing pages, demo request buttons)
It won't help much if you have fewer than 500 monthly visitors—you need volume for patterns to emerge.
What Heatmap Analysis Actually Is (and How It Works)
The Three Types of Heatmaps
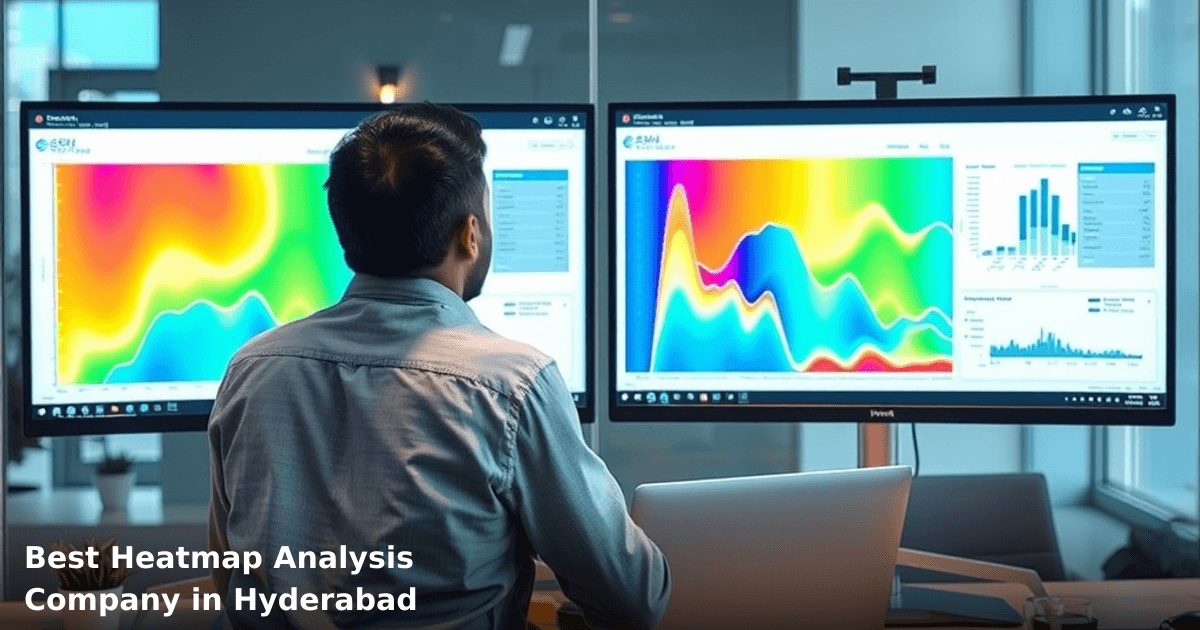
1. Click Heatmaps Shows where users click. Red zones = high clicks, blue zones = no clicks. Instantly reveals if your CTA button is being ignored or if users are clicking something you didn't intend them to.
2. Scroll Heatmaps Shows how far down the page users scroll before leaving. Common finding: 40% of users never scroll past the fold. If your best offer is below the fold, you're invisible.
3. Movement Heatmaps Tracks mouse movement (on desktop). Helps identify which page sections actually grab attention versus which are just visual clutter.
How Heatmap Analysis in Hyderabad, India Gets Implemented
- Install a tracking code (like Hotjar, Microsoft Clarity, or Contentsquare)
- Collect 500+ sessions of user data (typically 2–4 weeks)
- Analyze patterns: Where do users get stuck? Where do they click most?
- Cross-reference with Google Analytics to find high-bounce pages
- Recommend and test changes (A/B testing is the next step)
The best heatmap analysis companies don't just show you pretty visualizations—they connect the dots to your business metrics.
Comparison Table: Heatmap Analysis Tools & Services
| Tool/Service | Monthly Cost | Best For | Setup Time | Reporting |
|---|---|---|---|---|
| Hotjar (DIY) | ₹2,500–8,000 | Startups, self-service | 1 day | Dashboard only |
| Microsoft Clarity (Free) | ₹0 | Budget-conscious SMBs | 1 day | Basic, free |
| Contentsquare (Enterprise) | ₹40,000–1,50,000 | Large e-commerce, SaaS | 2–3 weeks | Advanced + consulting |
| Innovaira Heatmap + CRM Integration | ₹25,000–60,000 | SMBs wanting actionable insights | 1–2 weeks | Monthly strategy calls + recommendations |
| Local Hyderabad Agencies (generic) | ₹15,000–50,000 | SMBs wanting hands-on support | 2–4 weeks | Varies widely |
The gap between a tool and a service: Tools show you data. Services interpret it and tell you what to do next.
Step-by-Step Guide for Indian SMBs: Choosing the Right Heatmap Analysis Partner
We run campaigns like this for Indian businesses
From Google Ads to Meta — we handle strategy, creatives, targeting and weekly reporting end-to-end.
1. Define Your Specific Problem (Not Just "We Need Heatmaps")
Before you contact any heatmap analysis company in Hyderabad, know what you're trying to solve.
- High bounce rate on product pages? → Click + scroll heatmaps
- Low form submissions? → Click heatmaps on form fields
- Cart abandonment? → Movement + scroll heatmaps on checkout
- Unclear which CTA works? → A/B test via heatmaps
One of our clients, a real estate portal in Bangalore, came to us saying "We need heatmap analysis." After one conversation, we realized their real problem was that their property listing CTA was below the fold. Heatmaps confirmed it. The solution wasn't fancy analytics—it was moving one button.
2. Check Their Experience with Your Industry
Heatmap analysis in Hyderabad, India looks different for e-commerce vs. B2B vs. SaaS.
- E-commerce: Do they understand checkout optimization, product page flow?
- Real estate: Do they know how property portals work (image galleries, inquiry forms)?
- B2B/SaaS: Do they track product trials, demo requests, not just clicks?
- Services: Do they focus on lead form optimization?
Ask for case studies. Specifically, ask: "Show me a heatmap project in my industry and what changed because of it."
If they show you pretty heatmaps but no before/after conversion numbers, move on.
3. Ensure They Integrate with Your Existing Tools
Your heatmap data is only useful if it talks to your CRM, analytics, and advertising platforms.
- Does their heatmap tool connect to Google Analytics?
- Can they pull data into your CRM (like Zoho, Salesforce, or a custom system)?
- Do they integrate with your email platform for follow-up insights?
We've helped a logistics company in Hyderabad integrate heatmap data with their WhatsApp automation system—when a user abandoned a booking page, the system automatically sent them a reminder via WhatsApp. Conversion rate jumped from 12% to 28% in 6 weeks.
If setting up these integrations sounds complex, our CRM Development service can handle the backend—we've built custom systems that pull heatmap insights, trigger automations, and track ROI across all channels for SMBs across Delhi NCR and beyond.
4. Ask About Their Reporting and Recommendations
Data without action is just noise.
Good heatmap analysis companies give you:
- Monthly reports (not just raw dashboards)
- Specific recommendations ("Move the CTA button up 300px")
- Prioritized changes (fix the highest-impact problems first)
- Testing roadmap (which changes to test in which order)
- ROI tracking (how much revenue each change generated)
Bad ones show you heatmaps and say, "Here's your data. What do you think?"
5. Verify Their Pricing Model and Transparency
Heatmap analysis in Hyderabad, India ranges from ₹0 (free tools) to ₹1,50,000+/month (enterprise consulting).
- Free tier: Microsoft Clarity, basic Hotjar. Good for getting started, but no support.
- ₹5,000–15,000/month: DIY tools with setup help. You still interpret the data.
- ₹20,000–50,000/month: Managed service. They run the analysis, give recommendations.
- ₹50,000+/month: Enterprise with dedicated consultants.
For most Indian SMBs, ₹20,000–35,000/month gets you professional analysis + actionable insights. Anything cheaper is usually DIY-only. Anything more expensive should include strategy consulting and guaranteed ROI.
Ask: "What's included in your fee? Do you charge extra for recommendations? For implementation?"
Common Mistakes to Avoid
1. Collecting Data Without a Hypothesis Don't just turn on heatmaps and wait. Know what you're testing. "Why are users not converting?" is too vague. "Are users clicking the CTA button or ignoring it?" is testable.
2. Ignoring Mobile Heatmaps If 60% of your traffic is mobile, you need mobile heatmap data. Desktop and mobile behavior is completely different. Most poor heatmap analysis companies only show desktop.
3. Analyzing Too Little Data You need at least 500 sessions for patterns to emerge. If you analyze after 50 sessions, you're seeing noise, not trends.
4. Choosing Based on Price Alone A ₹5,000/month heatmap tool that shows you data you can't interpret is more expensive than a ₹35,000/month service that gives you actionable recommendations. We've seen SMBs waste ₹2 lakhs on free tools trying to figure out what the data means.
5. Not Following Up with A/B Testing Heatmaps show you what's happening. A/B testing shows you how to fix it. Good heatmap analysis companies should recommend testing, not just analysis.
Key Takeaways
- Heatmap analysis reveals user behavior that Google Analytics can't—where they click, scroll, and abandon
- For Indian SMBs, expect ₹20,000–50,000/month for professional analysis with actionable insights
- Choose based on industry experience, integration capabilities, and reporting quality—not just price
- The best heatmap analysis in Hyderabad, India includes recommendations and A/B testing roadmaps, not just visualizations
- Typical ROI: 15–35% conversion rate improvement within 2–3 months of implementing recommendations
- Mobile heatmaps are as important as desktop for most Indian businesses (60%+ mobile traffic is common)
- Start with a specific problem ("Low form submissions") not a vague goal ("We need analytics")
Frequently Asked Questions
Quick answers about heatmap-analysis-hyderabad-india
01 How much does heatmap analysis software actually cost for a small e-commerce business in Hyderabad? ›
Most heatmap tools in India range from ₹5,000–₹25,000 per month depending on your website traffic volume. If you're getting 50,000–100,000 monthly visitors, expect ₹8,000–₹12,000 for tools like Hotjar or Microsoft Clarity; agencies offering custom heatmap audits charge ₹15,000–₹40,000 as a one-time project fee. Avoid the trap of paying for enterprise plans—most SMBs max out at mid-tier subscriptions and see ROI within 2–3 months through conversion improvements.
02 How long does it take to see actionable insights from heatmap data? ›
You'll see initial patterns within 7–10 days of implementation, but reliable, decision-ready data takes 3–4 weeks of collection with at least 5,000–10,000 user sessions. Most Hyderabad-based agencies recommend running heatmaps for a full month before making design changes, since weekly data can be skewed by traffic spikes or seasonal variations. We typically see clients identify their first optimization opportunity (like a broken checkout button) within the first 2 weeks.
03 Is heatmap analysis worth it for a small D2C brand with just 10,000 monthly visitors? ›
Absolutely—in fact, smaller traffic volumes make heatmaps more valuable because every visitor counts. With 10,000 monthly visitors, you'll capture 300–400 meaningful user sessions per day, enough to spot clear friction points like where users drop off or which product images they ignore. Brands at your scale typically see 15–25% improvement in conversion rates after acting on heatmap insights, which often translates to ₹50,000–₹100,000 additional monthly revenue.
04 Why do most SMBs fail with heatmap analysis—what's the biggest mistake? ›
The biggest mistake is collecting heatmap data but never acting on it—we see 60% of Hyderabad businesses run heatmaps for 2–3 months, then stop because they don't have a structured process to implement changes. Most fail because they look at raw heatmaps without connecting the data to business goals; instead of asking "why is the cart abandonment high," they just see a red cluster and guess. Pair your heatmap with user session recordings and customer surveys—heatmaps show what users do, but recordings and feedback explain why.
05 What's the first step to get started with heatmap analysis if we've never done this before? ›
Start by choosing between a DIY tool (Hotjar or Clarity—₹0–₹8,000/month) or hiring a local agency (₹20,000–₹50,000 for a full audit). Install the tracking code on your highest-traffic pages (product pages, checkout, homepage) and let it run for 2 weeks before analyzing anything. Then book a 30-minute consultation with a Hyderabad-based conversion specialist (most offer free initial reviews) to interpret the heatmaps and prioritize which 2–3 changes will move your metrics most.
Need this built for your business?
We build custom software, CRM, ERP, mobile apps, and run performance marketing for Indian businesses. Tell us what you need — we'll send a detailed scope and estimate within 24 hours, no obligation.
- Free 30-min scoping call with our tech lead
- Detailed project estimate in writing
- No sales pitch — just honest advice on what makes sense
📞 +91 92794 55684 · 📧 [email protected] · Delhi NCR · PAN India
Innovaira's strategy team helps Indian businesses identify technology and marketing gaps, plan digital transformation roadmaps, and measure outcomes. Based in New Delhi, serving clients across India.