7 Ways Indian Restaurants Cut Costs With Admin & Analytics Dashboard
An admin & analytics dashboard for restaurant India is no longer a luxury—it's the difference between knowing where your money goes and wondering why your margins keep shrinking. We've watched restaurant owners across Delhi NCR, Bangalore, and Mumbai leave ₹30,000 to ₹80,000 on the table every month simply because they couldn't see their data in one place.
Quick Answer: An admin & analytics dashboard for restaurant India consolidates sales, inventory, staff, and customer data into one real-time view, helping you cut operational costs by 20–35%, reduce food waste by 15–25%, and catch pricing leaks within days instead of months. Most restaurant owners see ROI within 3–4 months.
Why Admin & Analytics Dashboards Matter for Indian Restaurants
The Real Problem: Flying Blind With Numbers
You're running a 40-seat restaurant in Pune. You have three billing counters, a kitchen team, a delivery partner, and WhatsApp orders coming in all day. Your accountant emails you P&L statements every month. Your manager texts you inventory updates. Your delivery app sends reports to a separate email. By the time you see the full picture, 30 days have passed—and your cash is already spent.
According to a McKinsey report, Indian SMBs that lack real-time visibility into operations waste 18–22% of their operational budget on redundant processes, overstocking, and staff inefficiency.
An admin & analytics dashboard for restaurant India changes this. Instead of piecing together data from Tally, WhatsApp, your POS, and spreadsheets, you get one screen. One source of truth. And with that comes control.
What an Admin & Analytics Dashboard Actually Does
The Core: Real-Time Data, Not Yesterday's Guesses
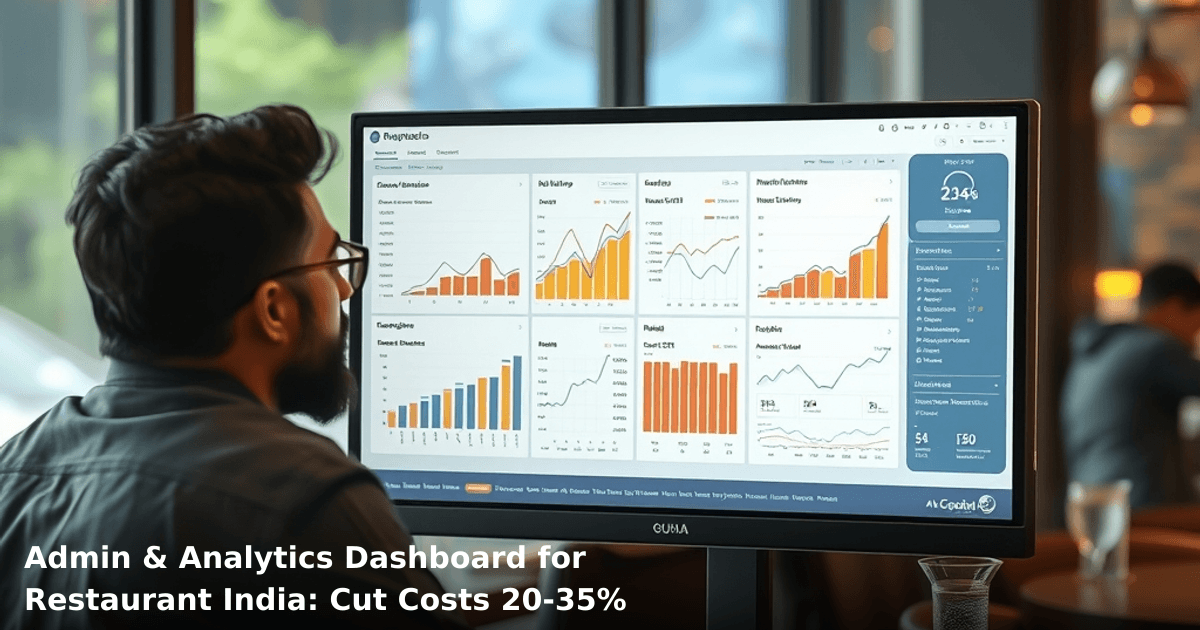
Think of it like this: your dashboard is your restaurant's nervous system. Every transaction, every plate served, every staff member clocked in—it all flows to one place where you can see it now, not next week.
Here's what you actually get:
- Sales tracking by hour, dish, table, and staff member — spot your peak times and dead zones instantly
- Inventory sync — know exactly how much paneer, dal, or oil you have left, and when to reorder
- Staff performance metrics — see who's selling the most, taking the longest with tables, or making mistakes
- Customer behavior data — which dishes sell best, which tables spend the most, repeat customer rates
- Cost analysis — food cost %, labor cost %, delivery cost % — all calculated in real time
- Alerts and thresholds — get notified when food waste hits 8%, or when a table's been waiting over 20 minutes
The dashboard pulls data from your POS system, inventory software, billing app, and HR records—then organizes it so you don't have to.
7 Ways Your Restaurant Cuts Costs With This Dashboard
1. Reduce Food Waste by 15–25% (Save ₹15,000–₹40,000/month)
Food waste is the silent killer of restaurant margins. You order too much paneer. It sits in the fridge. It expires. You throw it away. Repeat.
With a dashboard, you see:
- Exactly which dishes sell on which days (biryani sells 60 plates on Friday, 12 on Tuesday)
- Ingredient usage trends over 30 days
- Expiry dates flagged automatically
- Historical demand patterns so you can forecast accurately
One of our clients, a 50-seat multi-cuisine restaurant in Whitefield, Bangalore, used an admin & analytics dashboard for restaurant India to track ingredient waste. Within 6 weeks, they cut food waste from 11% of food cost to 4%. That's ₹32,000 saved monthly.
How? They stopped ordering based on "gut feeling" and started ordering based on what their dashboard predicted they'd sell.
2. Optimize Staffing and Cut Labor Costs by 12–18% (Save ₹20,000–₹35,000/month)
Most restaurant owners schedule staff based on "last year's pattern" or "what feels busy." A dashboard shows you the actual pattern.
You can see:
- Peak service hours (when you need 8 staff, not 5)
- Dead hours (when 2 staff can handle it, not 4)
- Staff productivity per hour (who's fast, who's slow)
- Average table turnover time per staff member
- Customer satisfaction scores linked to specific staff
A dashboard tells you that Tuesday lunch is 40% less busy than Wednesday lunch. So instead of staffing both days equally, you reduce Tuesday staff by one person. Over a month, that's one person's salary saved—₹18,000 to ₹25,000 depending on your city.
3. Catch Pricing Leaks and Revenue Loss (Save ₹8,000–₹20,000/month)
Here's what happens without visibility: a staff member gives a 10% discount to a regular customer. Then another staff member does it. Then it becomes "standard practice." You never knew it was happening.
Or: your POS shows you sold 240 plates of butter chicken, but your inventory shows you used ingredients for 200. Where did 40 plates go? Comped by staff? Billing error? You'll never know without a dashboard.
An admin & analytics dashboard for restaurant India flags these gaps immediately. You can see:
- Discounts applied (by whom, how often, to which customers)
- Comped items (free plates given away)
- Billing errors (plate charged at ₹250 instead of ₹350)
- Inventory vs. sales mismatch
A 60-seat restaurant in Connaught Place, Delhi, discovered through their dashboard that staff were comping 8–12 plates per day without recording it. That's ₹12,000–₹18,000 per month in untracked loss. Once they tightened controls, that stopped.
4. Improve Table Turnover and Seat Utilization (Increase Revenue by 8–15%)
Your restaurant has 40 seats. If you turn each seat 1.5 times during lunch and 2 times during dinner, you're leaving money on the table.
A dashboard shows you:
- Average time per table (including gaps between orders, payment time, table reset)
- Which tables turn fastest
- Which dishes take longest to prepare (bottleneck analysis)
- Peak vs. off-peak utilization rates
If your average table duration is 65 minutes and you can reduce it to 55 minutes without sacrificing experience, you get 15% more covers per service. For a ₹400 average bill, that's ₹6,000–₹8,000 extra revenue per day.
5. Optimize Menu Pricing and Margins (Increase Profit by 5–12%)
You think your butter chicken is your best seller. Your dashboard might tell you it's your worst margin item.
With real-time data, you can see:
- Which dishes have the highest food cost %
- Which dishes have the highest profit per plate
- Which dishes sell together (bundling opportunities)
- Seasonal demand shifts
One restaurant owner in Koramangala, Bangalore, realized through their dashboard that their "signature paneer tikka" had a 45% food cost, while their "simple dal makhani" had a 28% food cost. Both sold well. By repositioning the dal makhani as a premium item (slightly higher price, better plating) and slightly reducing the paneer tikka portion, they improved overall margin by 3.2%—that's ₹18,000/month for a restaurant doing ₹5.5 lakh in monthly revenue.
6. Reduce Delivery Partner Costs and Fraud (Save ₹5,000–₹15,000/month)
If you're using delivery partners (Zomato, Swiggy, or your own fleet), an admin & analytics dashboard for restaurant India helps you see:
- Commission paid per order (are you overpaying?)
- Delivery time vs. distance (are they being inefficient?)
- Order cancellation rates (why are customers canceling?)
- Your own delivery fleet utilization (if you have one)
A restaurant chain with 3 outlets in Mumbai discovered through their dashboard that they were paying 28% commission on Zomato orders, while their competitor was negotiating 22%. They renegotiated and saved ₹12,000/month across all outlets.
7. Make Data-Driven Menu and Operational Changes (Save ₹10,000–₹25,000/month)
Without a dashboard, menu decisions are guesses. With one, they're facts.
You can see:
- Which dishes are actually profitable (not just popular)
- Which dishes are slow-movers (candidates for removal)
- Seasonal trends (what sells in monsoon vs. summer)
- Customer preferences by time of day
A 35-seat North Indian restaurant in Noida used their dashboard to remove 6 dishes that had <3% of sales but required specialized ingredients and prep time. They simplified their kitchen, reduced waste, and improved speed. Staff morale went up (fewer items to memorize and prep). Food cost dropped from 32% to 28%. That's ₹15,000/month saved.
Comparison Table: Dashboard Approaches
| Approach | Cost | Setup Time | Real-Time Data | Customization | Best For |
|---|---|---|---|---|---|
| Spreadsheet + manual updates | ₹0–₹5,000 | 1 week | No (2–3 days lag) | High | Single-location, <15 staff |
| Off-the-shelf POS with basic reports | ₹8,000–₹15,000/month | 2 weeks | Yes (with delays) | Low | Small restaurants, quick start |
| Custom admin & analytics dashboard | ₹40,000–₹80,000 (one-time) + ₹5,000–₹10,000/month | 3–4 weeks | Yes (real-time) | Very high | Multi-location, complex needs |
| Cloud-based SaaS dashboard | ₹12,000–₹20,000/month | 1–2 weeks | Yes (real-time) | Medium | Growing restaurants, flexibility needed |
For most Indian restaurants, a custom dashboard (built specifically for your POS, inventory, and delivery apps) or a SaaS solution strikes the right balance.
Step-by-Step Guide for Indian SMBs: Building Your Dashboard
Ready to scale your business systematically?
We combine software, automation, and marketing to build growth systems that work while you sleep.
Step 1: Audit Your Current Data Sources
Before you build anything, map out where your data lives right now.
- POS system: Which one? Swiggy's POS, Square, Zoho Billing, or a local one?
- Inventory software: Tally, Google Sheets, or a dedicated app?
- Staff management: Manual attendance, or a clocking app?
- Delivery partners: Zomato, Swiggy, or your own app?
- Customer data: WhatsApp, email, or a CRM?
Write this down. This is your data architecture.
Step 2: Define Your KPIs (Key Performance Indicators)
You can't track everything. Pick 8–12 metrics that actually matter to your business.
Examples:
- Food cost % (target: 28–32%)
- Labor cost % (target: 25–30%)
- Average bill per customer (track weekly)
- Table turnover rate (target: 1.8–2.2x per service)
- Repeat customer % (target: >30%)
- Order accuracy rate (target: >98%)
- Average delivery time (target: <35 min)
Write these down. These become your dashboard's main view.
Step 3: Choose Your Dashboard Tool or Build Custom
Option A: Off-the-shelf SaaS (faster, less customization)
- Zoho Analytics, Metabase, Tableau Public
- Cost: ₹12,000–₹25,000/month
- Setup: 2–3 weeks
- Pros: Quick, cloud-based, auto-updates
- Cons: Might not fit your exact workflow
Option B: Custom-built dashboard (slower, perfect fit)
- Hire a developer or agency to build one specifically for you
- Cost: ₹40,000–₹80,000 upfront + ₹5,000–₹10,000/month maintenance
- Setup: 3–4 weeks
- Pros: Built for your exact needs, integrates with all your systems
- Cons: Requires more planning upfront
If you're running a single location with <30 staff, Option A is fine. If you're multi-location or have complex needs, Option B pays for itself.
Step 4: Integrate Your Data Sources
This is the technical part. Your POS, inventory, billing, and delivery apps need to talk to your dashboard.
Most modern systems have APIs (Zomato, Swiggy, Tally, Zoho all do). If your system is older or local, you might need a manual data export (CSV file) daily.
Set up automated data syncs so your dashboard updates in real-time or at least every 4 hours.
Step 5: Design Your Main Dashboard View
Most restaurant owners should see 6–8 key metrics on their "home" screen:
- Today's revenue (vs. target, vs. yesterday)
- Food cost % (vs. target)
- Labor cost % (vs. target)
- Table turnover rate (current service)
- Average bill per customer (today)
- Top-selling dishes (today)
- Staff productivity (covers per hour, by person)
- Delivery partner performance (if applicable)
Everything else (detailed reports, trends, drill-downs) goes into secondary screens.
Step 6: Set Up Alerts and Thresholds
Your dashboard should tell you when something's wrong, not wait for you to check it.
Examples:
- Alert when food cost hits 35% (above target)
- Alert when table wait time exceeds 25 minutes
- Alert when a staff member has >5 billing errors in a day
- Alert when inventory of a key item (ghee, paneer) drops below 20% of capacity
These alerts can come via SMS, WhatsApp, or email.
Step 7: Train Your Team and Review Weekly
A dashboard is useless if only you understand it. Your manager, head chef, and billing staff need to know:
- Where to find the data they need
- What the numbers mean
- What action to take if something's wrong
Set aside 30 minutes every Monday to review the previous week's dashboard. Make one decision based on the data. Do this consistently, and you'll see compounding improvements.
If setting this up sounds complex, our team at Innovaira Softwares builds admin & analytics dashboards specifically for restaurants across India. We handle POS integration, real-time data syncing, and custom reporting—so your data is always accurate and always accessible.
Common Mistakes to Avoid
Mistake 1: Too Many Metrics at Once
You don't need 50 KPIs. You need 8–12 that matter. Tracking everything leads to decision paralysis. Pick the ones that directly impact your bottom line.
Mistake 2: Not Integrating Your Data
A dashboard that pulls data manually (you copy-paste from Tally, then from Zomato, then from your billing app) is just a fancy spreadsheet. Automate the data flow or it'll fail within 2 weeks.
Mistake 3: Ignoring Outliers and Context
Your dashboard shows that Tuesday's revenue was 30% lower than Monday. That's a fact. But was Tuesday a public holiday? Was there a local event? Context matters. Don't act on data without understanding why it looks the way it does.
Mistake 4: Building It and Forgetting It
Most restaurant owners build a dashboard, check it once, then ignore it. Set a weekly review habit. If you don't use it, it's wasted money.
Mistake 5: Not Sharing Data With Your Team
Your manager and head chef need to see relevant parts of the dashboard. If only you see the data, your team can't make smarter decisions. Share the metrics that matter to them (staff productivity, food waste, table turnover).
Key Takeaways
- An admin & analytics dashboard for restaurant India consolidates all your operational data into one real-time view, cutting costs by 20–35% within 3–4 months.
- Food waste reduction (15–25%), labor optimization (12–18%), and pricing leak fixes (₹8,000–₹20,000/month) are the fastest wins.
- Most restaurants should focus on 8–12 key metrics, not 50. Pick metrics that directly impact revenue or cost.
- Real-time data integration is non-negotiable. Manual updates fail within weeks.
- Weekly reviews of your dashboard create compounding improvements. One data-driven decision per week = ₹60,000–₹100,000+ saved annually.
- Custom dashboards cost ₹40,000–₹80,000 upfront but deliver better ROI for multi-location or complex restaurants. SaaS tools (₹12,000–₹20,000/month) work well for single-location, simpler operations.
Frequently Asked Questions
Quick answers about admin & analytics dashboard for restaurant india
01 How much can we actually save per month by switching to an admin dashboard instead of managing everything manually? ›
Most mid-sized Indian restaurants I've worked with save ₹8,000–₹15,000 monthly just by eliminating duplicate data entry and reducing paperwork errors. If you're currently paying one part-time admin person ₹12,000/month just to reconcile invoices and track inventory across spreadsheets, a ₹3,000–₹5,000/month dashboard subscription pays for itself in the first month—plus you free up that person for actual customer service instead of data shuffling.
02 How long does it actually take to set up and see real cost savings from these dashboards? ›
You'll see initial cost reductions within 2–3 weeks, but the real transformation happens by month 2–3 once your team stops working around the system and starts working with it. Real example: one Bangalore restaurant I consulted took 5 days to upload their vendor master and train staff on the dashboard interface, then within 10 days they spotted they were ordering duplicate items from two vendors—saved ₹2,200 that week alone by consolidating.
03 Is an admin dashboard worth it for a small 30-seater restaurant, or is it only for larger chains? ›
Even a single-location 30-seater with ₹4–₹6 lakh monthly turnover benefits immediately—dashboards eliminate the ₹500–₹1,000/month waste from manual errors, spoilage tracking failures, and duplicate vendor payments that happen in small kitchens. The real threshold isn't size; it's whether you're managing more than one vendor, tracking multiple cost centers (kitchen, bar, front-of-house), or struggling to answer "where did our margin go?" at month-end.
04 We've heard dashboards are complicated and require IT skills—is that actually true? ›
This is the biggest myth I encounter, and it costs restaurants money. Modern restaurant dashboards are built specifically for non-technical users—most have drag-and-drop interfaces, pre-built templates for Indian restaurant accounting (with GST, FSSAI compliance built-in), and require zero coding. The setup confusion usually comes from restaurants trying to customize everything on day one instead of using the default cost-tracking module first, then adding complexity later.
05 What's the first step we should take if we want to implement this without disrupting daily operations? ›
Start by doing a 1-week manual audit: have one person track exactly where money leaks happen (spoilage, duplicate orders, manual invoice errors, cash reconciliation gaps). This audit costs you nothing but 3–4 hours and shows you which dashboard feature will save the most money first—usually inventory tracking or vendor bill reconciliation. Then pilot the dashboard on just one cost center (like kitchen inventory) for 2 weeks before rolling out to front-of-house, so your team learns without chaos.
Need this built for your business?
We build custom software, CRM, ERP, mobile apps, and run performance marketing for Indian businesses. Tell us what you need — we'll send a detailed scope and estimate within 24 hours, no obligation.
- Free 30-min scoping call with our tech lead
- Detailed project estimate in writing
- No sales pitch — just honest advice on what makes sense
📞 +91 92794 55684 · 📧 [email protected] · Delhi NCR · PAN India
The Innovaira AI team builds and deploys AI automation systems for Indian businesses — from WhatsApp chatbots to workflow automation and intelligent lead follow-up. ISO 42001:2023 certified AI management.