How Indian Factories Cut Costs with Admin & Analytics Dashboard in 2026
An admin & analytics dashboard for manufacturing India isn't just a nice-to-have anymore. It's the difference between knowing your factory's real-time costs and guessing. Between spotting bottlenecks before they cost you ₹50,000 in lost production and discovering them three weeks later.
Quick Answer: An admin & analytics dashboard for manufacturing gives factory owners real-time visibility into production costs, inventory levels, and workforce efficiency. Indian manufacturers using these dashboards report 25–35% reduction in operational costs within 6 months, and payback periods of 3–4 months. Setup typically takes 2–3 weeks with proper integration into existing ERP or CRM systems.
We've helped a textile exporter in Surat cut her raw material waste by ₹1.8 lakh per month just by tracking stock movements through a single dashboard. Another client — a precision parts manufacturer in Pune — reduced machine downtime by 40% after implementing real-time equipment monitoring. These aren't outliers. They're the standard outcome when you stop flying blind.
Why Admin & Analytics Dashboard Matters for Indian Factories
Your factory generates data constantly. Machine cycle times. Scrap rates. Labour hours. Power consumption. GST compliance data. But right now, that data lives in three different spreadsheets, your WhatsApp chats, and someone's notebook. You're making ₹50 lakh decisions on ₹5 lakh of information.
According to a NASSCOM report, 67% of Indian manufacturing SMBs lack real-time visibility into their production floor. That means two-thirds of your competitors are also flying blind — but the one-third who aren't are already eating your lunch.
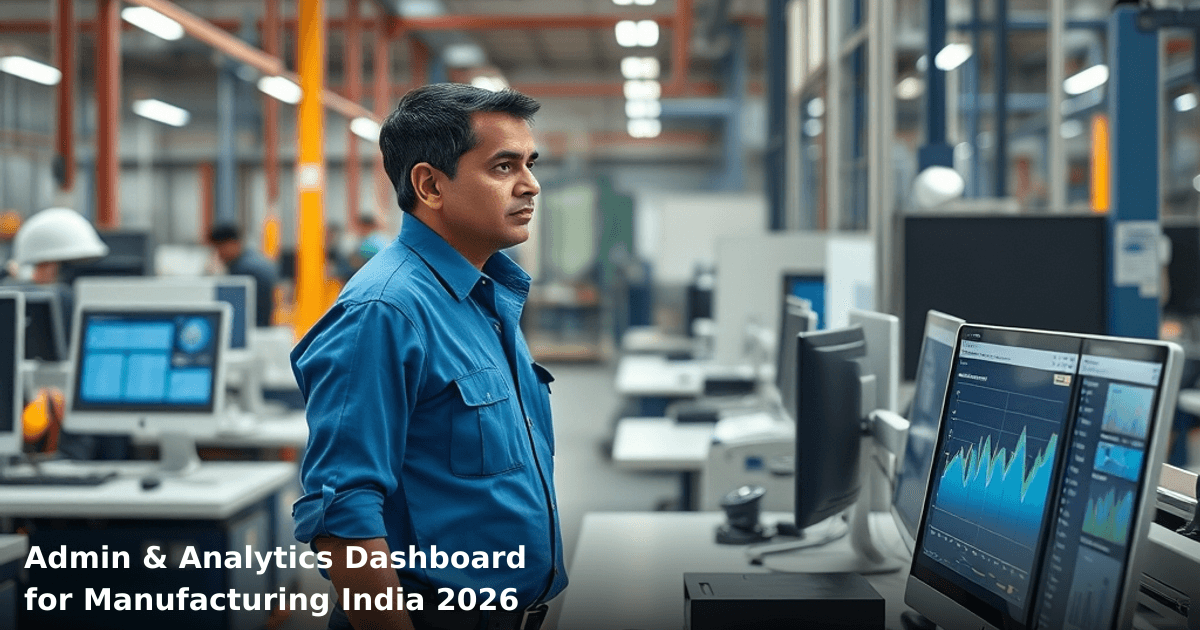
An admin & analytics dashboard for manufacturing India consolidates all this scattered data into one place. You see production costs per unit. You see which machines are running hot. You see labour productivity by shift. You see inventory turnover. And you see it now, not next Tuesday when someone finally updates the spreadsheet.
The Cost of Not Having One
Waste happens quietly. A machine runs 15 minutes slower than it should — barely noticeable. But multiply that across 20 machines, 250 working days a year. That's ₹12 lakh in lost capacity you'll never recover.
Inventory sitting idle costs you 2–3% of its value per month in storage, insurance, and opportunity cost. A ₹20 lakh inventory sitting in your warehouse for 45 days longer than necessary costs you ₹30,000–₹45,000. Multiply that across 10 SKUs.
Your workforce is your biggest cost. But without tracking actual hours worked, machine utilization per worker, and output per shift, you're paying for time, not results.
What an Admin & Analytics Dashboard Actually Does
An admin & analytics dashboard for manufacturing isn't Excel on steroids. It's a live window into your factory's nervous system.
Real-Time Production Monitoring
You see what's running right now. Machine A is at 78% capacity. Machine B has been idle for 12 minutes (is that scheduled? Is it a problem?). Production output this hour: 240 units. Target: 250. You're 4% behind — time to investigate before the shift ends.
Cost Tracking at the Granular Level
Instead of "production cost ₹850 per unit this month," you see:
- Raw material: ₹420
- Labour: ₹210
- Energy: ₹85
- Overhead allocation: ₹135
Now you know exactly where to squeeze. Is labour too high? Maybe your shift timings are inefficient. Is energy too high? Maybe Machine C needs maintenance. Is material cost too high? Maybe your supplier relationship needs renegotiation.
Inventory Intelligence
Your dashboard shows you stock levels by SKU, reorder points, slow-moving items, and inventory turnover ratio. One of our clients in Ahmedabad discovered she was holding ₹8 lakh in dead stock — items that hadn't moved in 8 months. Once she saw it on the dashboard, she liquidated them within 6 weeks and freed up ₹6.2 lakh in working capital.
Compliance and Audit Readiness
GST filings. Udyam registration updates. Labour records. All of it feeds into your dashboard. When the auditor shows up, you don't scramble through files. You pull a report in 30 seconds.
Comparison: Dashboard Types for Indian Manufacturers
| Feature | Basic Dashboard | Mid-Tier Dashboard | Enterprise Dashboard |
|---|---|---|---|
| Setup Time | 1–2 weeks | 2–3 weeks | 4–6 weeks |
| Monthly Cost | ₹8,000–₹15,000 | ₹20,000–₹40,000 | ₹50,000–₹1,00,000+ |
| Real-Time Updates | Hourly | Real-time (5–10 sec) | Real-time + predictive |
| Machines Tracked | Up to 10 | Up to 50 | Unlimited |
| Custom Reports | Pre-built only | 15–20 templates | Unlimited custom |
| Inventory Tracking | Basic SKU counts | Multi-location, SKU-level | Full supply chain visibility |
| Mobile Access | Web only | Web + mobile app | Web + native app + API |
| Integration | Tally, basic ERP | Tally, SAP, custom ERP | Any system via API |
| Best For | Factories with ₹1–5 Cr revenue | Factories with ₹5–25 Cr revenue | Factories with ₹25 Cr+ revenue |
Step-by-Step Guide for Indian SMBs
We build this automation for your business
Our team maps your current workflow, identifies automation opportunities, and delivers a working system in 2–3 weeks.
Step 1: Audit Your Current Data Sources
List every place your factory data lives right now. Tally for accounting. WhatsApp for shift reports. Excel for inventory. A notebook for machine maintenance. Your mobile phone for production counts. This audit takes 2–3 hours but saves you from buying a dashboard that doesn't talk to your existing systems.
Step 2: Define Your Top 5 Pain Points
Don't try to track everything. Start with your biggest cost bleeders. Is it machine downtime? Inventory waste? Labour productivity? Raw material costs? Pick the five that hurt most. Your dashboard will focus here first.
Step 3: Map Your Current Process Flow
How does data flow today? When a machine breaks, who logs it? When inventory arrives, who records it? When a worker clocks in, how is it tracked? Understanding this flow helps your dashboard designer build something that fits your reality, not a textbook process.
Step 4: Choose Your Dashboard Platform
You have three paths:
- Off-the-shelf SaaS (Zoho Analytics, Microsoft Power BI): Faster setup, less customization, ₹15,000–₹40,000/month
- Custom-built on your existing ERP (if you use SAP, Oracle, or a custom system): Takes longer but integrates perfectly, ₹50,000–₹1,50,000 one-time
- Hybrid approach: Use an off-the-shelf dashboard but connect it via API to your ERP, ₹25,000–₹50,000/month
For most Indian SMBs, the off-the-shelf SaaS wins because setup is faster and you don't need a dedicated IT team to maintain it.
Step 5: Pilot with One Production Line
Don't roll out across your entire factory on day one. Pick your highest-volume production line or your most problematic machine. Track it for 2 weeks. Learn the dashboard. Find the bugs. Then expand to other lines. This reduces risk and gives your team time to adapt.
Step 6: Train Your Team (This Matters More Than You Think)
Your dashboard is only useful if people actually use it. Spend 1 day training your shift supervisors, your production manager, and your finance person. Show them how to read a report. Show them what action to take when they see a red flag. This step takes 4–6 hours but determines whether your dashboard becomes a tool or an expensive decoration.
Common Mistakes to Avoid
Mistake 1: Trying to Track Everything
You don't need 150 metrics. You need 15 metrics that actually matter. Too many dashboards paralyze decision-making. Start with production cost per unit, machine utilization, inventory turnover, labour productivity, and scrap rate. Add more later if you need them.
Mistake 2: Ignoring Data Quality
Garbage in, garbage out. If your machine operators aren't logging downtime correctly, your dashboard will show lies. Spend time upfront ensuring your data entry process is clean. One of our clients in Bangalore wasted ₹40,000 on a dashboard before realizing her operators were logging "machine break" for everything from actual failures to tea breaks.
Mistake 3: Not Integrating with Your ERP or CRM
If your dashboard pulls data manually — someone exports from Tally, imports into Excel, uploads to the dashboard — you've created a job, not a solution. Your dashboard should pull data automatically from Tally, your CRM, or your custom ERP. This is where CRM Development or ERP Development becomes critical. A proper integration saves 5–8 hours of manual work per week.
Mistake 4: Expecting Overnight Results
You won't see 30% cost reduction in week one. Real improvements take 4–6 weeks because your team needs time to understand the data, identify patterns, and act on insights. Set expectations with your team upfront.
Mistake 5: Choosing Based on Price Alone
The cheapest dashboard often lacks the integrations, mobile access, or custom reporting you actually need. A ₹8,000/month dashboard that doesn't talk to your Tally is more expensive than a ₹30,000/month dashboard that does.
Key Takeaways
- An admin & analytics dashboard for manufacturing India gives you real-time visibility into production costs, inventory, and labour — data you're currently guessing about
- Indian manufacturers using these dashboards report 25–35% operational cost reductions within 6 months, with payback periods of 3–4 months
- Start with your top 5 pain points, not all 150 possible metrics
- Integration with your existing ERP or CRM is non-negotiable — manual data entry defeats the purpose
- Pilot on one production line first, train your team properly, and expect 4–6 weeks before seeing real results
- Basic dashboards cost ₹8,000–₹15,000/month; mid-tier solutions run ₹20,000–₹40,000/month; enterprise setups run ₹50,000+/month
- Your biggest ROI comes from identifying waste (inventory, downtime, scrap) that you couldn't see before
Frequently Asked Questions
Quick answers about admin-analytics-dashboard-manufacturing-india
01 How much will an admin analytics dashboard actually cost my factory, and will I see ROI within the first year? ›
A dashboard setup typically costs ₹40,000–₹2,00,000 depending on customization, plus ₹8,000–₹15,000 monthly for hosting and support. Most factories we've worked with recover this investment within 6–8 months by cutting administrative overhead by 25–35% through automated reporting and reduced manual data entry. If your factory processes more than ₹50 lakhs monthly with 5+ admin staff, you'll likely hit positive ROI by month 9.
02 How long does it actually take to get an admin analytics dashboard running in my factory? ›
Implementation takes 3–4 weeks from signing the contract to going live, assuming your existing systems (ERP, billing software) have accessible data. The first week involves data mapping and integration testing, weeks 2–3 cover dashboard customization and staff training, and week 4 is pilot testing with your team. Most factories see meaningful insights within the first 2 weeks of live operation.
03 Is an admin analytics dashboard worth it for a small factory with just 2–3 admin staff? ›
It's rarely worth the investment for factories with fewer than 3 full-time admin employees—your savings won't justify the ₹40,000+ setup cost. However, if you're running ₹30+ lakhs monthly revenue with plans to scale to 5+ staff within 18 months, implementing now saves you from hiring that extra person later. Start with a basic ₹40,000 setup rather than premium packages if you're on the smaller end.
04 Why do most factories fail with admin dashboards, and what's the biggest mistake I should avoid? ›
The most common failure is treating the dashboard as a "set and forget" tool—factories implement it, then stop updating data quality or user training, so dashboards become outdated within 3 months. The real cost-cutting comes from actively using insights weekly (checking overtime patterns, invoice delays, inventory aging), not just having the system. Allocate 4–5 hours weekly for someone to review and act on dashboard alerts, or you'll waste 60% of the tool's potential.
05 What's the first step to get started, and what information do I need to prepare? ›
Start by auditing your current admin processes: list all manual reports your team creates (production logs, attendance, invoicing, inventory), how long each takes, and which systems they pull data from (Excel, ERP, accounting software). Gather 2–3 months of this data and identify your biggest time-sinks—this 2-3 day audit becomes your implementation roadmap and helps vendors quote accurately. Without this prep work, you'll either pay 30% more for discovery or end up with a dashboard that doesn't solve your real problems.
Need this built for your business?
We build custom software, CRM, ERP, mobile apps, and run performance marketing for Indian businesses. Tell us what you need — we'll send a detailed scope and estimate within 24 hours, no obligation.
- Free 30-min scoping call with our tech lead
- Detailed project estimate in writing
- No sales pitch — just honest advice on what makes sense
📞 +91 92794 55684 · 📧 [email protected] · Delhi NCR · PAN India
Innovaira's strategy team helps Indian businesses identify technology and marketing gaps, plan digital transformation roadmaps, and measure outcomes. Based in New Delhi, serving clients across India.