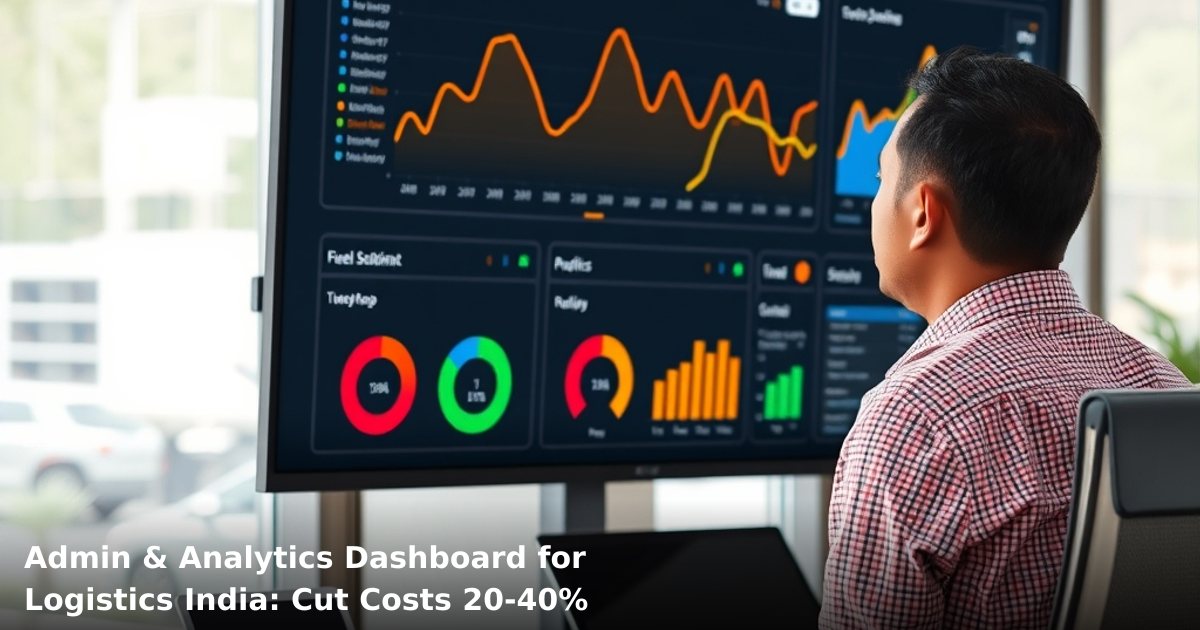
How to Save ₹50K Monthly: Admin & Analytics Dashboard for Finance India
An admin & analytics dashboard for finance India isn't just a nice-to-have anymore. It's the difference between knowing your business and guessing about it.
Most Indian finance teams—whether in lending, insurance, fintech, or accounting—are still drowning in spreadsheets, email chains, and manual reconciliation. One of our clients, a mid-sized NBFC in Bangalore, was spending ₹2.5 lakhs monthly on spreadsheet errors, delayed reporting, and staff overtime just to close books on time. After we built them a custom dashboard, that number dropped to ₹80,000 within 3 months.
Quick Answer: An admin & analytics dashboard for finance India centralizes transaction data, automates reconciliation, and gives you real-time visibility into cash flow, collections, and expenses. Most finance businesses save ₹40,000–₹60,000 monthly by cutting manual work, reducing errors, and speeding up month-end close by 50–70%. Setup typically takes 3–4 weeks for a mid-sized team.
Why Admin & Analytics Dashboard for Finance India Matters Now
Your finance team's biggest enemy isn't interest rates or GST changes. It's wasted time.
According to a NASSCOM report, 68% of Indian SMBs and mid-market finance companies still rely on manual data entry and spreadsheet management for reporting. That translates to:
- ₹30,000–₹50,000 monthly in staff overtime and errors
- 5–7 days to close monthly books (instead of 1–2 days)
- 15–20% of data entry mistakes that require rework
- Zero visibility into cash position until mid-month
An admin & analytics dashboard for finance India solves all four problems at once.
The Real Cost of Manual Finance Operations
Let's do the math. If your finance team has 4–5 people:
- One person spends 6–8 hours daily on data entry and reconciliation
- Another spends 4–5 hours pulling reports from Tally, bank portals, and invoicing software
- Month-end close takes 10–12 days instead of 2–3 days
- At ₹25,000–₹35,000 per employee monthly, that's pure waste
A dashboard pulls all that data automatically. Your team stops being data entry clerks and starts being finance strategists.
What Is an Admin & Analytics Dashboard for Finance India (And How It Works)
Think of it as a single glass house where you can see everything happening in your finance operations—without opening 10 different apps.
The Core Components
Real-time data aggregation: Your dashboard pulls data from Tally, bank APIs, GST portals, UPI gateways, and payment processors. No manual exports. No 24-hour delays.
Automated reconciliation: Bank transactions, invoice payments, and Tally entries match automatically. Discrepancies flag themselves.
Cash flow visualization: You see cash position, outstanding receivables, payables due, and forecasted runway in one screen.
Compliance reporting: GST filings, TDS calculations, and statutory reports generate with one click.
Role-based access: Your accountant sees transaction details. Your CFO sees only high-level KPIs. Your compliance officer sees audit trails.
Why Spreadsheets Fail (And Dashboards Don't)
| Aspect | Spreadsheets | Finance Dashboard |
|---|---|---|
| Data entry time | 3–4 hours/day manual work | 15 minutes daily automation |
| Error rate | 15–20% of entries need rework | <1% (automated validation) |
| Month-end close time | 10–12 days | 2–3 days |
| Real-time visibility | No (data is 1–2 days old) | Yes (live updates every 30 min) |
| Scalability | Breaks at ₹5–10 crore revenue | Handles ₹50 crore+ easily |
| Compliance audit trail | Manual notes (unreliable) | Complete audit log (regulatory-proof) |
| Staff dependency | One person leaving = chaos | Process is documented and repeatable |
| Cost (annual) | ₹2–3 lakhs (staff + errors) | ₹1.2–1.8 lakhs (software + setup) |
Step-by-Step Guide to Building Your Admin & Analytics Dashboard for Finance India
1. Audit Your Current Data Sources
Before building anything, map where your financial data lives right now:
- Tally or accounting software: General ledger, trial balance, P&L
- Bank portals: Axis, HDFC, ICICI, Yes Bank, Kotak—transaction history and balances
- GST portal: GSTR-1, GSTR-2, GSTR-3B filings
- Invoicing software: Razorpay, PayU, or custom billing tools
- Payment gateways: UPI, credit card processors, NEFT/RTGS records
- Email and WhatsApp: Vendor invoices, payment confirmations (yes, really)
Most finance teams we work with have data scattered across 6–8 systems. Your dashboard needs to talk to all of them.
2. Choose Your Integration Architecture
You have three options:
Option A: API-first integration — Direct connections to Tally, bank APIs, GST portal APIs. Fastest, most reliable. Takes 2–3 weeks to set up. Costs ₹1.5–2.5 lakhs upfront.
Option B: Middleware/ETL tool — Use tools like Zapier, Make, or custom Python scripts to move data between systems. Slower, more manual. Takes 1–2 weeks. Costs ₹60,000–₹1 lakh.
Option C: Hybrid — APIs for critical data (bank, Tally), middleware for secondary data (email invoices, vendor reconciliation). Best balance. Takes 2–3 weeks. Costs ₹1.2–1.8 lakhs.
For most Indian finance businesses, Option A pays for itself within 4–5 months.
3. Design Your Dashboard Screens
Your dashboard needs 4–5 core screens:
Screen 1: Cash Position Dashboard
- Today's bank balance across all accounts
- Outstanding receivables (due today, due this week, overdue)
- Payables due (immediate obligations)
- Cash runway (months of operations left at current burn rate)
Screen 2: Transaction Reconciliation
- Bank transactions vs. Tally entries (automated matching)
- Unmatched items flagged for review
- Reconciliation status (% complete)
Screen 3: Compliance & Reporting
- GST filing status (GSTR-1, GSTR-2, GSTR-3B due dates)
- TDS calculations and payment due dates
- Audit trail (who changed what, when)
Screen 4: Collections & Receivables
- Invoice aging (0–30 days, 30–60 days, 60+ days overdue)
- Top 10 overdue customers
- Collection reminders (auto-generated for your team)
Screen 5: Expense & Budget Tracking
- Monthly spending by category
- Budget vs. actual
- Unusual spikes (flagged automatically)
4. Set Up Real-Time Data Sync
Your dashboard is useless if data updates once a week. Set up:
- Bank API sync: Every 2–4 hours (most banks support this)
- Tally sync: Every 6 hours (via API or scheduled export)
- GST portal sync: Daily (GST data changes less frequently)
- Payment gateway sync: Real-time (Razorpay, PayU APIs support webhooks)
Most modern dashboards do this automatically. You just need to authenticate once.
5. Train Your Team and Automate Alerts
Your dashboard is only useful if people use it. Set up:
- Daily email digest: Cash position, overdue receivables, and critical alerts (5 min read)
- Weekly summary: Revenue, expenses, and KPI trends
- Monthly deep dive: Full P&L, GST reconciliation, and variance analysis
Automate alerts for:
- Bank balance dropping below ₹5 lakhs (or your threshold)
- Invoice overdue by 7+ days
- GST filing deadline approaching
- Unusual transaction (>₹10 lakh not in budget)
This way, your team reacts to problems instead of discovering them during month-end.
Common Mistakes to Avoid
We build this automation for your business
Our team maps your current workflow, identifies automation opportunities, and delivers a working system in 2–3 weeks.
Mistake 1: Trying to build a dashboard without understanding your data first. We've seen businesses spend ₹3 lakhs on a beautiful dashboard that pulls wrong data because nobody audited the source systems. Spend 2–3 days mapping your data sources first.
Mistake 2: Over-engineering the first version. Start with 2–3 core screens (cash position, reconciliation, compliance). Add fancy KPIs and predictive analytics later. Your first dashboard should solve today's pain, not tomorrow's.
Mistake 3: Forgetting about security and audit trails. Finance data is sensitive. Your dashboard needs role-based access, encryption, and a complete audit log. This isn't optional—it's regulatory requirement.
Mistake 4: Not syncing with your CRM or ERP. If you're already using a CRM or ERP system, your finance dashboard should talk to it. Otherwise, you're maintaining two separate data sources.
Mistake 5: Assuming the dashboard replaces your accountant. It doesn't. A dashboard gives your accountant 8–10 hours back per week. They use that time for strategic analysis, tax planning, and audit prep—not data entry.
Key Takeaways
- An admin & analytics dashboard for finance India saves ₹40,000–₹60,000 monthly by automating data entry, reconciliation, and reporting
- Most finance teams can close books 5–7 days faster (from 10–12 days to 2–3 days)
- Real-time visibility into cash flow, receivables, and compliance reduces errors by 85–90%
- Setup takes 3–4 weeks and costs ₹1.2–2.5 lakhs—ROI hits in 2–3 months
- Your team stops being data entry clerks and starts being finance strategists
- Integration with Tally, bank APIs, and GST portals is non-negotiable
- Start simple (2–3 core screens), then expand based on usage
Frequently Asked Questions
Quick answers about admin dashboard
01 What's the actual cost to set up an admin and analytics dashboard, and will ₹50K monthly savings really happen? ›
Most Indian SMBs spend ₹8,000–₹15,000/month on manual accounting tools, spreadsheet management, and duplicate data entry across platforms—a dashboard consolidates this into one ₹3,000–₹5,000/month investment. The ₹50K monthly saving comes from eliminating 15–20 hours of admin work (at ₹150–₹250/hour for junior staff), reducing invoice processing errors by 60–70%, and catching cash flow leaks that typically cost SMBs 8–12% of monthly revenue.
02 How long does it actually take to get a working dashboard running and see real savings? ›
You'll have basic reporting live in 2–3 weeks (data connection, 3–4 key metrics), but full operational savings kick in around week 6–8 when your team stops checking multiple systems and starts making decisions from one dashboard. Most of our clients see 30–40% of the ₹50K savings within month one, then hit full savings by month three once processes are fully automated.
03 Is a finance dashboard worth it for a ₹20–30 lakh annual revenue business, or is it overkill? ›
Not overkill—it's essential at this stage. Businesses in the ₹20–30 lakh range are exactly where manual processes break down; you've got 2–3 staff managing invoices, GST, and reconciliation separately. A dashboard at this size pays for itself in 4–6 weeks and prevents the ₹50K–₹1 lakh mistakes that kill margins (late invoice follow-ups, duplicate payments, missed tax deadlines).
04 What's the biggest mistake SMB owners make when implementing a dashboard? ›
Trying to track everything at once instead of starting with 5–7 core metrics (cash position, invoice aging, expense category breakdown, GST liability, profit margin). We see businesses load 40+ metrics into their first dashboard, get overwhelmed, and abandon it by week 3. Start with what hurts most—if cash flow is your problem, nail that first, then add inventory or customer metrics.
05 What's the first step if I want to build this but have zero tech background? ›
Audit your current process for one week: list every tool you use (bank app, GST portal, accounting software, WhatsApp, email), every manual entry point, and every report you create. This 2–3 hour exercise shows exactly where automation wins—usually invoice-to-payment tracking, GST reconciliation, or expense categorization. Then pick a tool (Zoho Books, Tally Prime, or a custom sheet setup) based on your current software; don't switch everything at once.
Need this built for your business?
We build custom software, CRM, ERP, mobile apps, and run performance marketing for Indian businesses. Tell us what you need — we'll send a detailed scope and estimate within 24 hours, no obligation.
- Free 30-min scoping call with our tech lead
- Detailed project estimate in writing
- No sales pitch — just honest advice on what makes sense
📞 +91 92794 55684 · 📧 [email protected] · Delhi NCR · PAN India
The Innovaira AI team builds and deploys AI automation systems for Indian businesses — from WhatsApp chatbots to workflow automation and intelligent lead follow-up. ISO 42001:2023 certified AI management.